We will use the mtcars dataset to showcase how you can use {funkyheatmap} to visualise a dataset. We will gradually add features to the plot to show how you can customise it to your liking.
Loading the data
First, we load in the data. We move the rownames to a column named
id, as that is required by {funkyheatmap}
to display the names. Next, we sort the dataframe on the
mpg column in descending order, and select the top 30
rows.
library(funkyheatmap)
library(dplyr, warn.conflicts = FALSE)
library(tibble, warn.conflicts = FALSE)
library(purrr, warn.conflicts = FALSE)

data("mtcars")

data <- mtcars %>%
  rownames_to_column("id") %>%
  arrange(desc(mpg)) %>%
  head(30)
We can plot this data frame without any additional formatting, though it doesn’t look very nice:
funky_heatmap(data)
#> ℹ No column info was provided, assuming all columns in `data` are to be plotted.
#> ℹ Column info did not contain column `name`, using `id` to generate it.
#> ℹ Column info did not contain information on which columns to plot, inferring from `data` types.
#> ℹ Column info did not contain group information, assuming columns are ungrouped.
#> ℹ Column info did not contain a column called 'palette', generating palettes based on the 'geom' column.
#> ℹ Column info did not contain a column called 'width', generating options based on the 'geom' column.
#> ℹ Column info did not contain a column called 'legend', generating options based on the 'geom' column.
#> ℹ No row info was provided, assuming all rows in `data` are to be plotted.
#> ℹ Row info did not contain group information, assuming rows are ungrouped.
#> ℹ No palettes were provided, trying to automatically assign palettes.
#> ℹ Palette named 'numerical_palette' was not defined. Assuming palette is numerical. Automatically selected palette 'Blues'.
#> ℹ No legends were provided, trying to automatically infer legends.
#> ℹ Some palettes were not used in the column info, adding legends for them.
#> ℹ Legend 1 did not contain a geom, inferring from the column info.
#> ℹ Legend 1 did not contain labels, inferring from the geom.
#> ℹ Legend 1 did not contain size, inferring from the labels.
#> ℹ Legend 1 did not contain color, inferring from the palette.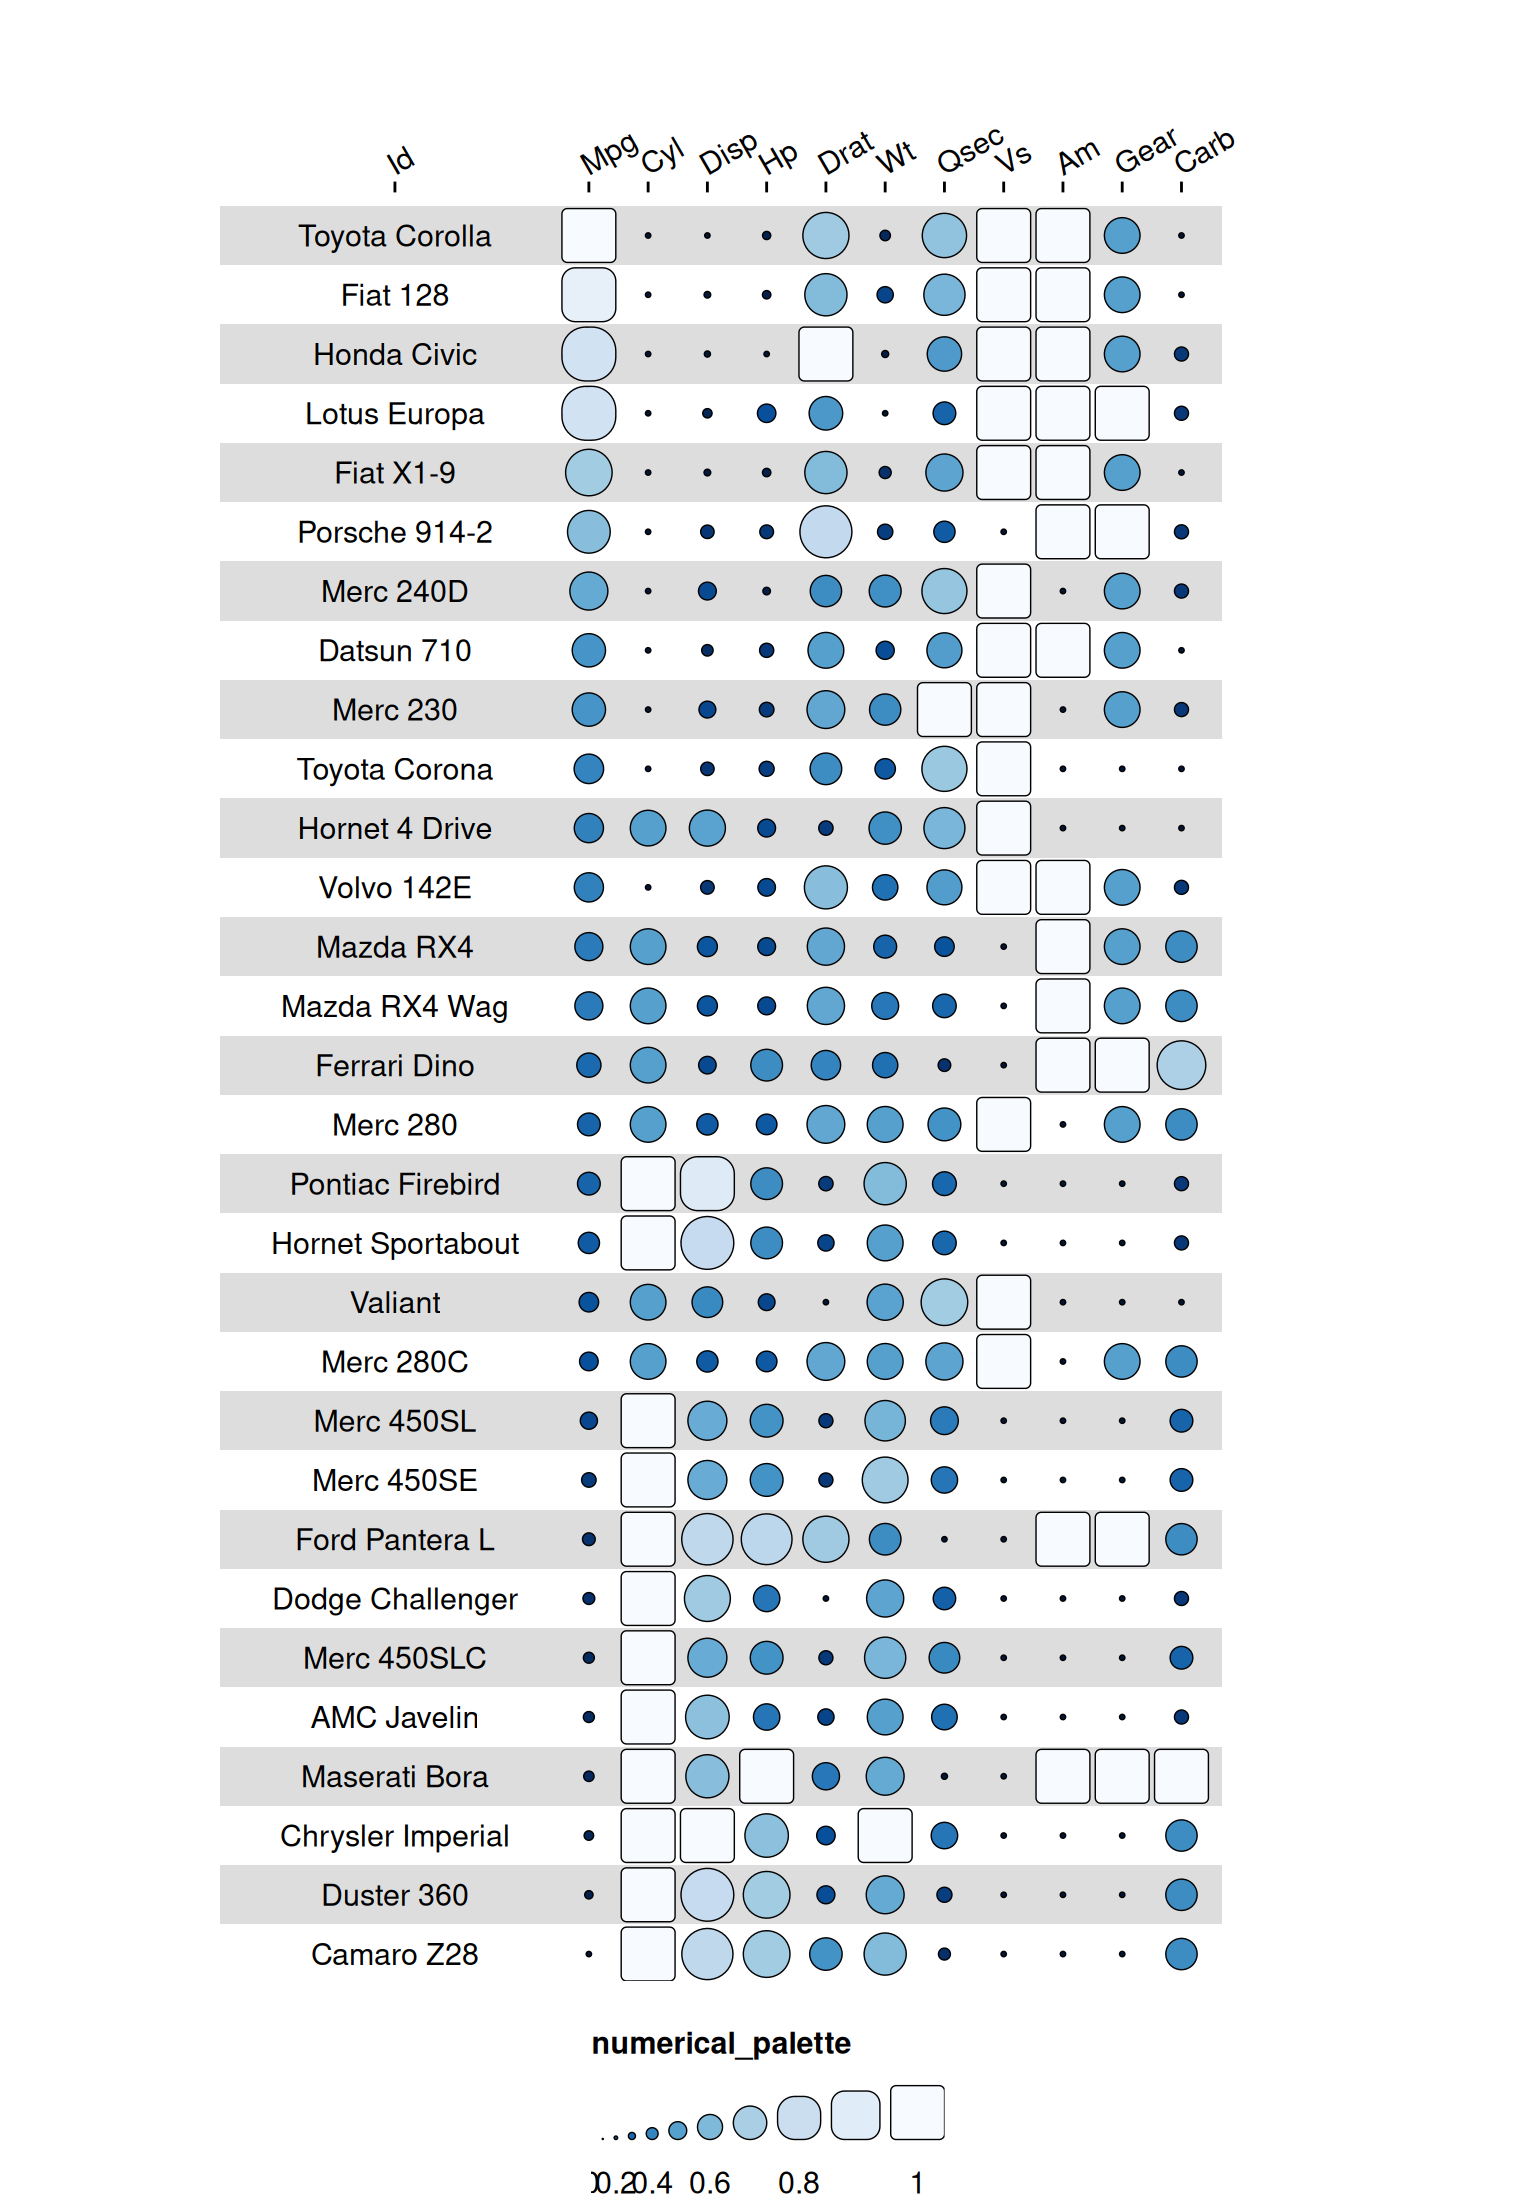
Adding column_info
We can add column information to the heatmap by specifying the
column_info argument. This argument should be a dataframe
or a tibble, with each row corresponding to a column in the heatmap. The
dataframe should have the following column: -
id (character): the name of the column in the heatmap
Other columns are optional and will determine the appearance of the
heatmap. If you want to group some of the columns together, usually
because they are semantically related, or another logical grouping
exists, we need to sepficy the group column in the
column_info dataframe.
cinfo <- tibble(
  id = colnames(data),
  group = c(NA, "Overall", "Engine", "Engine", "Engine", "Transmission", "Overall", "Performance", "Engine", "Transmission", "Transmission", "Engine"),
  options = lapply(seq(12), function(x) lst())
)
cinfo
#> # A tibble: 12 × 3
#>    id    group        options
#>    <chr> <chr>        <list>
#>  1 id    NA           <named list [0]>
#>  2 mpg   Overall      <named list [0]>
#>  3 cyl   Engine       <named list [0]>
#>  4 disp  Engine       <named list [0]>
#>  5 hp    Engine       <named list [0]>
#>  6 drat  Transmission <named list [0]>
#>  7 wt    Overall      <named list [0]>
#>  8 qsec  Performance  <named list [0]>
#>  9 vs    Engine       <named list [0]>
#> 10 am    Transmission <named list [0]>
#> 11 gear  Transmission <named list [0]>
#> 12 carb  Engine       <named list [0]>
funky_heatmap(data, column_info = cinfo)
#> ℹ Column info did not contain column `name`, using `id` to generate it.
#> ℹ Column info did not contain information on which columns to plot, inferring from `data` types.
#> ℹ Column info did not contain a column called 'palette', generating palettes based on the 'geom' column.
#> ℹ Column info did not contain a column called 'width', generating options based on the 'geom' column.
#> ℹ Column info did not contain a column called 'legend', generating options based on the 'geom' column.
#> ℹ No row info was provided, assuming all rows in `data` are to be plotted.
#> ℹ Row info did not contain group information, assuming rows are ungrouped.
#> ℹ No column groups was provided, deriving from column info.
#> ℹ Column groups did not contain a column called 'palette'. Assuming no colour scales need to be used.
#> ℹ Column groups did not contain a column called 'level1'. Using `column_info$group` as a makeshift column group name.
#> ℹ No palettes were provided, trying to automatically assign palettes.
#> ℹ Palette named 'numerical_palette' was not defined. Assuming palette is numerical. Automatically selected palette 'Blues'.
#> ℹ No legends were provided, trying to automatically infer legends.
#> ℹ Some palettes were not used in the column info, adding legends for them.
#> ℹ Legend 1 did not contain a geom, inferring from the column info.
#> ℹ Legend 1 did not contain labels, inferring from the geom.
#> ℹ Legend 1 did not contain size, inferring from the labels.
#> ℹ Legend 1 did not contain color, inferring from the palette.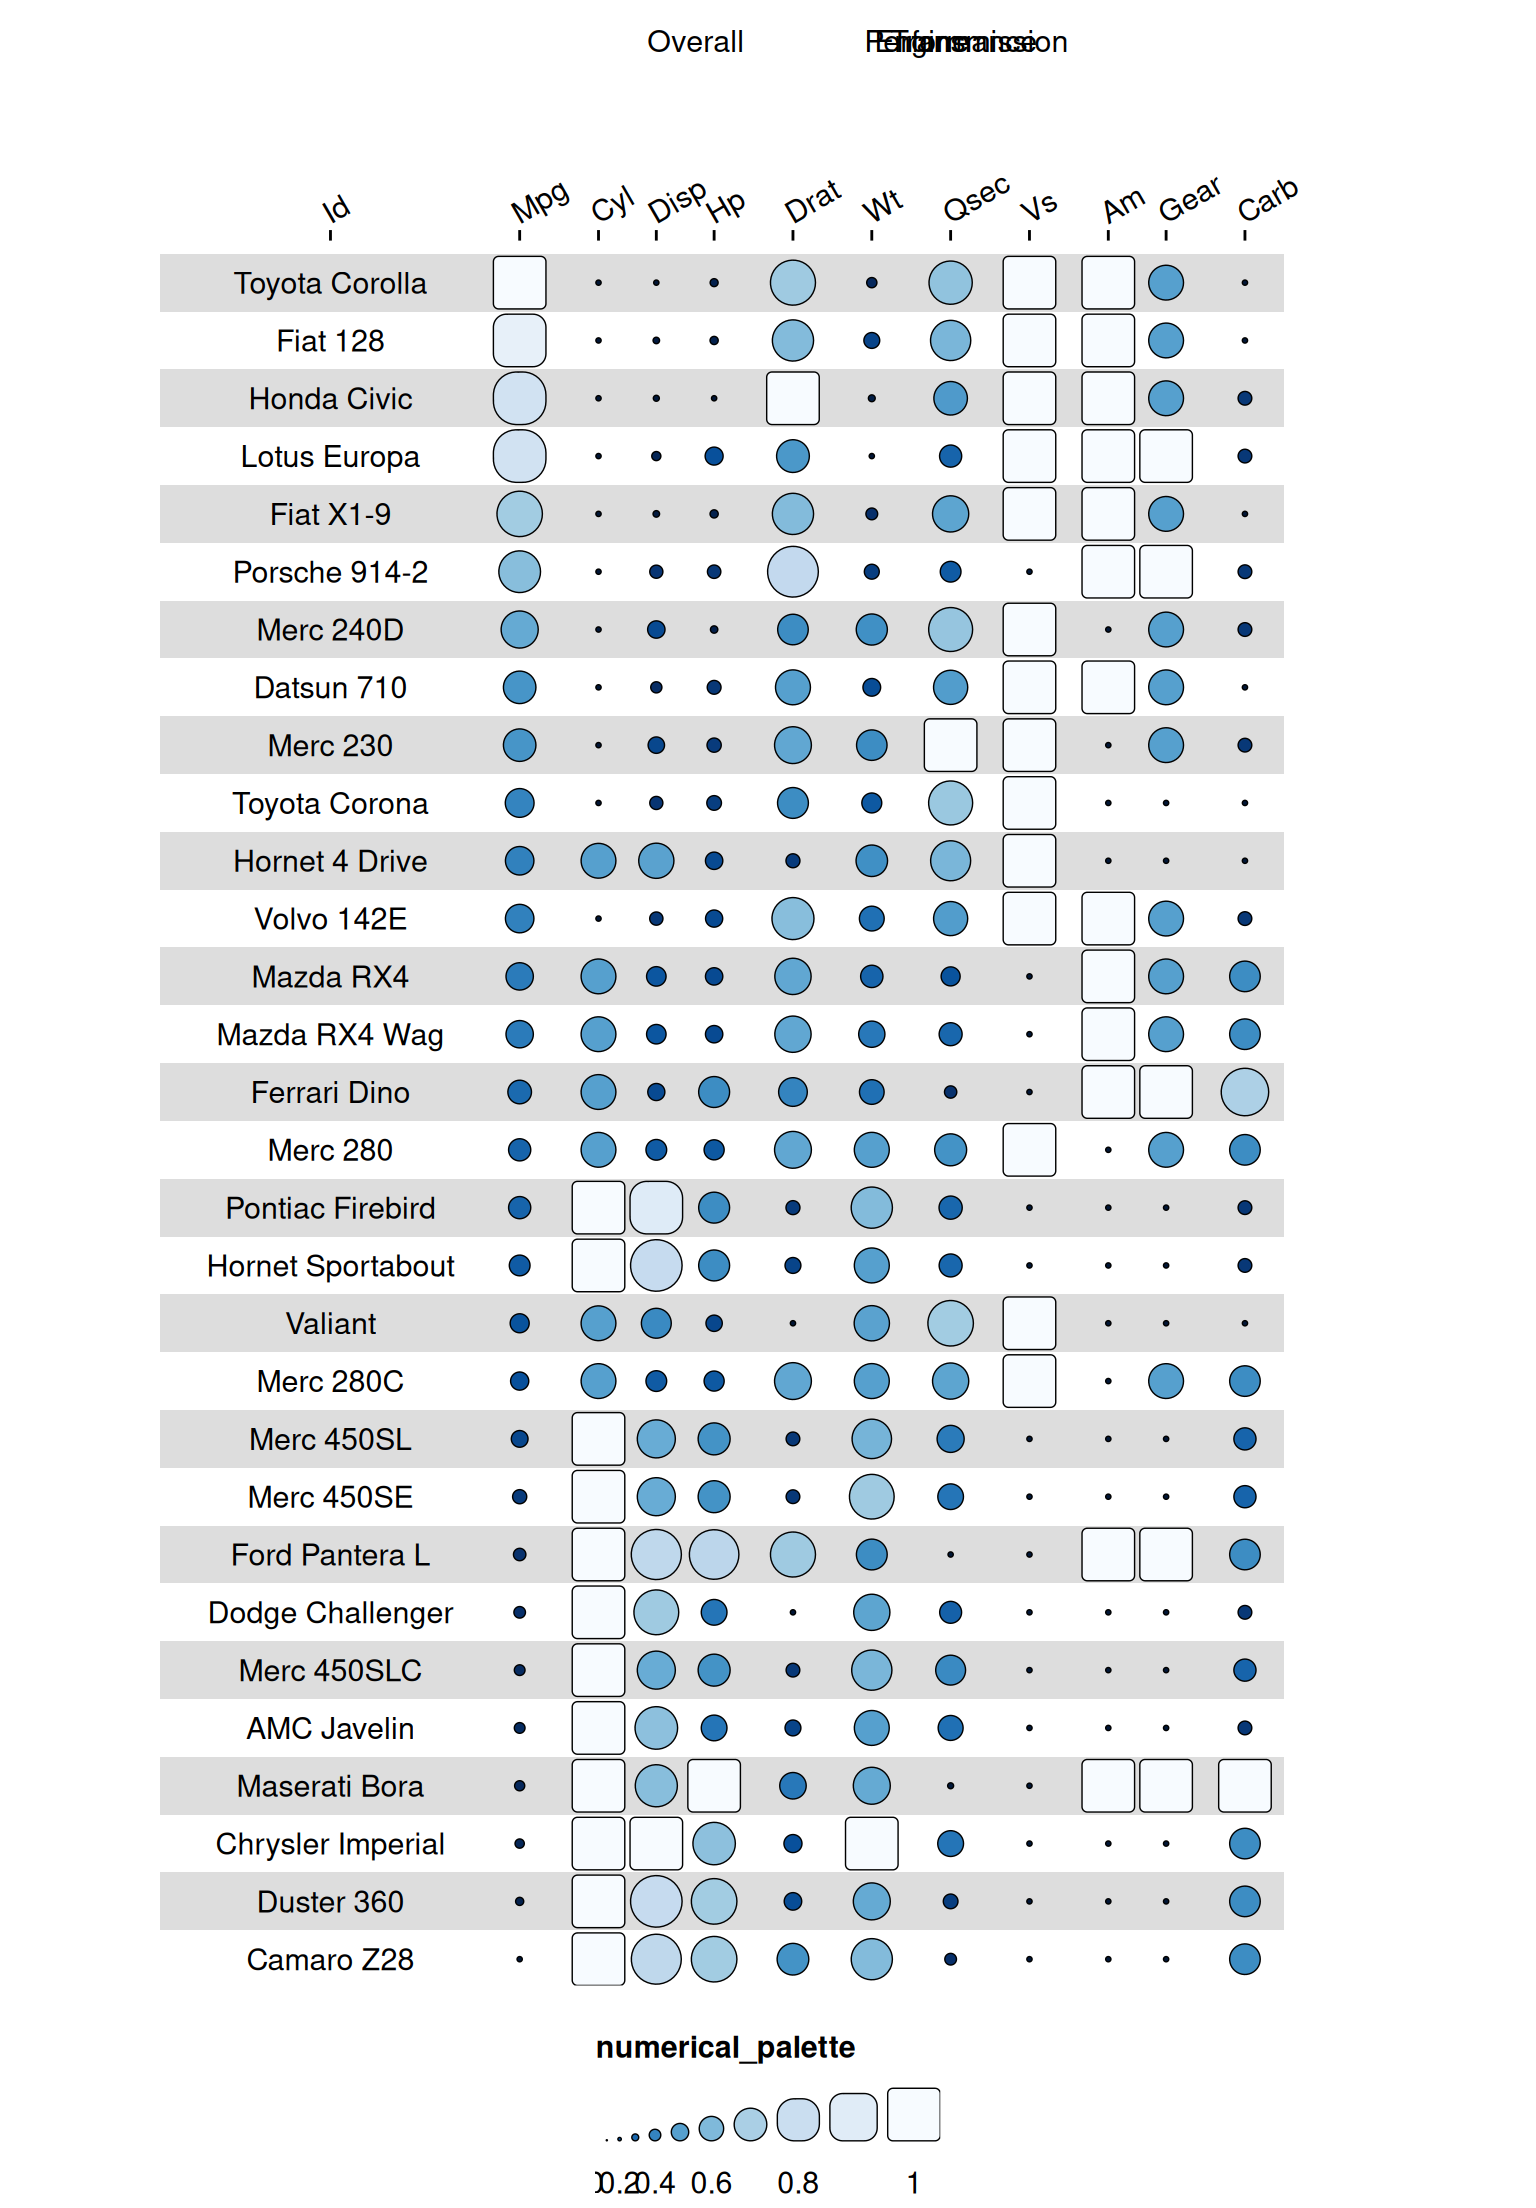
We can see that this does not work: we need to manually rearrange the
columns in the column_info dataframe so that the columns in
the same column groups are adjacent to each other.
data <- data[, c("id", "qsec", "mpg", "wt", "cyl", "carb", "disp", "hp", "vs", "drat", "am", "gear")]

cinfo <- tibble(
  id = colnames(data),
  group = c(NA, "Performance", rep("Overall", 2), rep("Engine", 5), rep("Transmission", 3)),
  options = lapply(seq(12), function(x) lst())
)
cinfo
#> # A tibble: 12 × 3
#>    id    group        options
#>    <chr> <chr>        <list>
#>  1 id    NA           <named list [0]>
#>  2 qsec  Performance  <named list [0]>
#>  3 mpg   Overall      <named list [0]>
#>  4 wt    Overall      <named list [0]>
#>  5 cyl   Engine       <named list [0]>
#>  6 carb  Engine       <named list [0]>
#>  7 disp  Engine       <named list [0]>
#>  8 hp    Engine       <named list [0]>
#>  9 vs    Engine       <named list [0]>
#> 10 drat  Transmission <named list [0]>
#> 11 am    Transmission <named list [0]>
#> 12 gear  Transmission <named list [0]>

funky_heatmap(data, column_info = cinfo)
#> ℹ Column info did not contain column `name`, using `id` to generate it.
#> ℹ Column info did not contain information on which columns to plot, inferring from `data` types.
#> ℹ Column info did not contain a column called 'palette', generating palettes based on the 'geom' column.
#> ℹ Column info did not contain a column called 'width', generating options based on the 'geom' column.
#> ℹ Column info did not contain a column called 'legend', generating options based on the 'geom' column.
#> ℹ No row info was provided, assuming all rows in `data` are to be plotted.
#> ℹ Row info did not contain group information, assuming rows are ungrouped.
#> ℹ No column groups was provided, deriving from column info.
#> ℹ Column groups did not contain a column called 'palette'. Assuming no colour scales need to be used.
#> ℹ Column groups did not contain a column called 'level1'. Using `column_info$group` as a makeshift column group name.
#> ℹ No palettes were provided, trying to automatically assign palettes.
#> ℹ Palette named 'numerical_palette' was not defined. Assuming palette is numerical. Automatically selected palette 'Blues'.
#> ℹ No legends were provided, trying to automatically infer legends.
#> ℹ Some palettes were not used in the column info, adding legends for them.
#> ℹ Legend 1 did not contain a geom, inferring from the column info.
#> ℹ Legend 1 did not contain labels, inferring from the geom.
#> ℹ Legend 1 did not contain size, inferring from the labels.
#> ℹ Legend 1 did not contain color, inferring from the palette.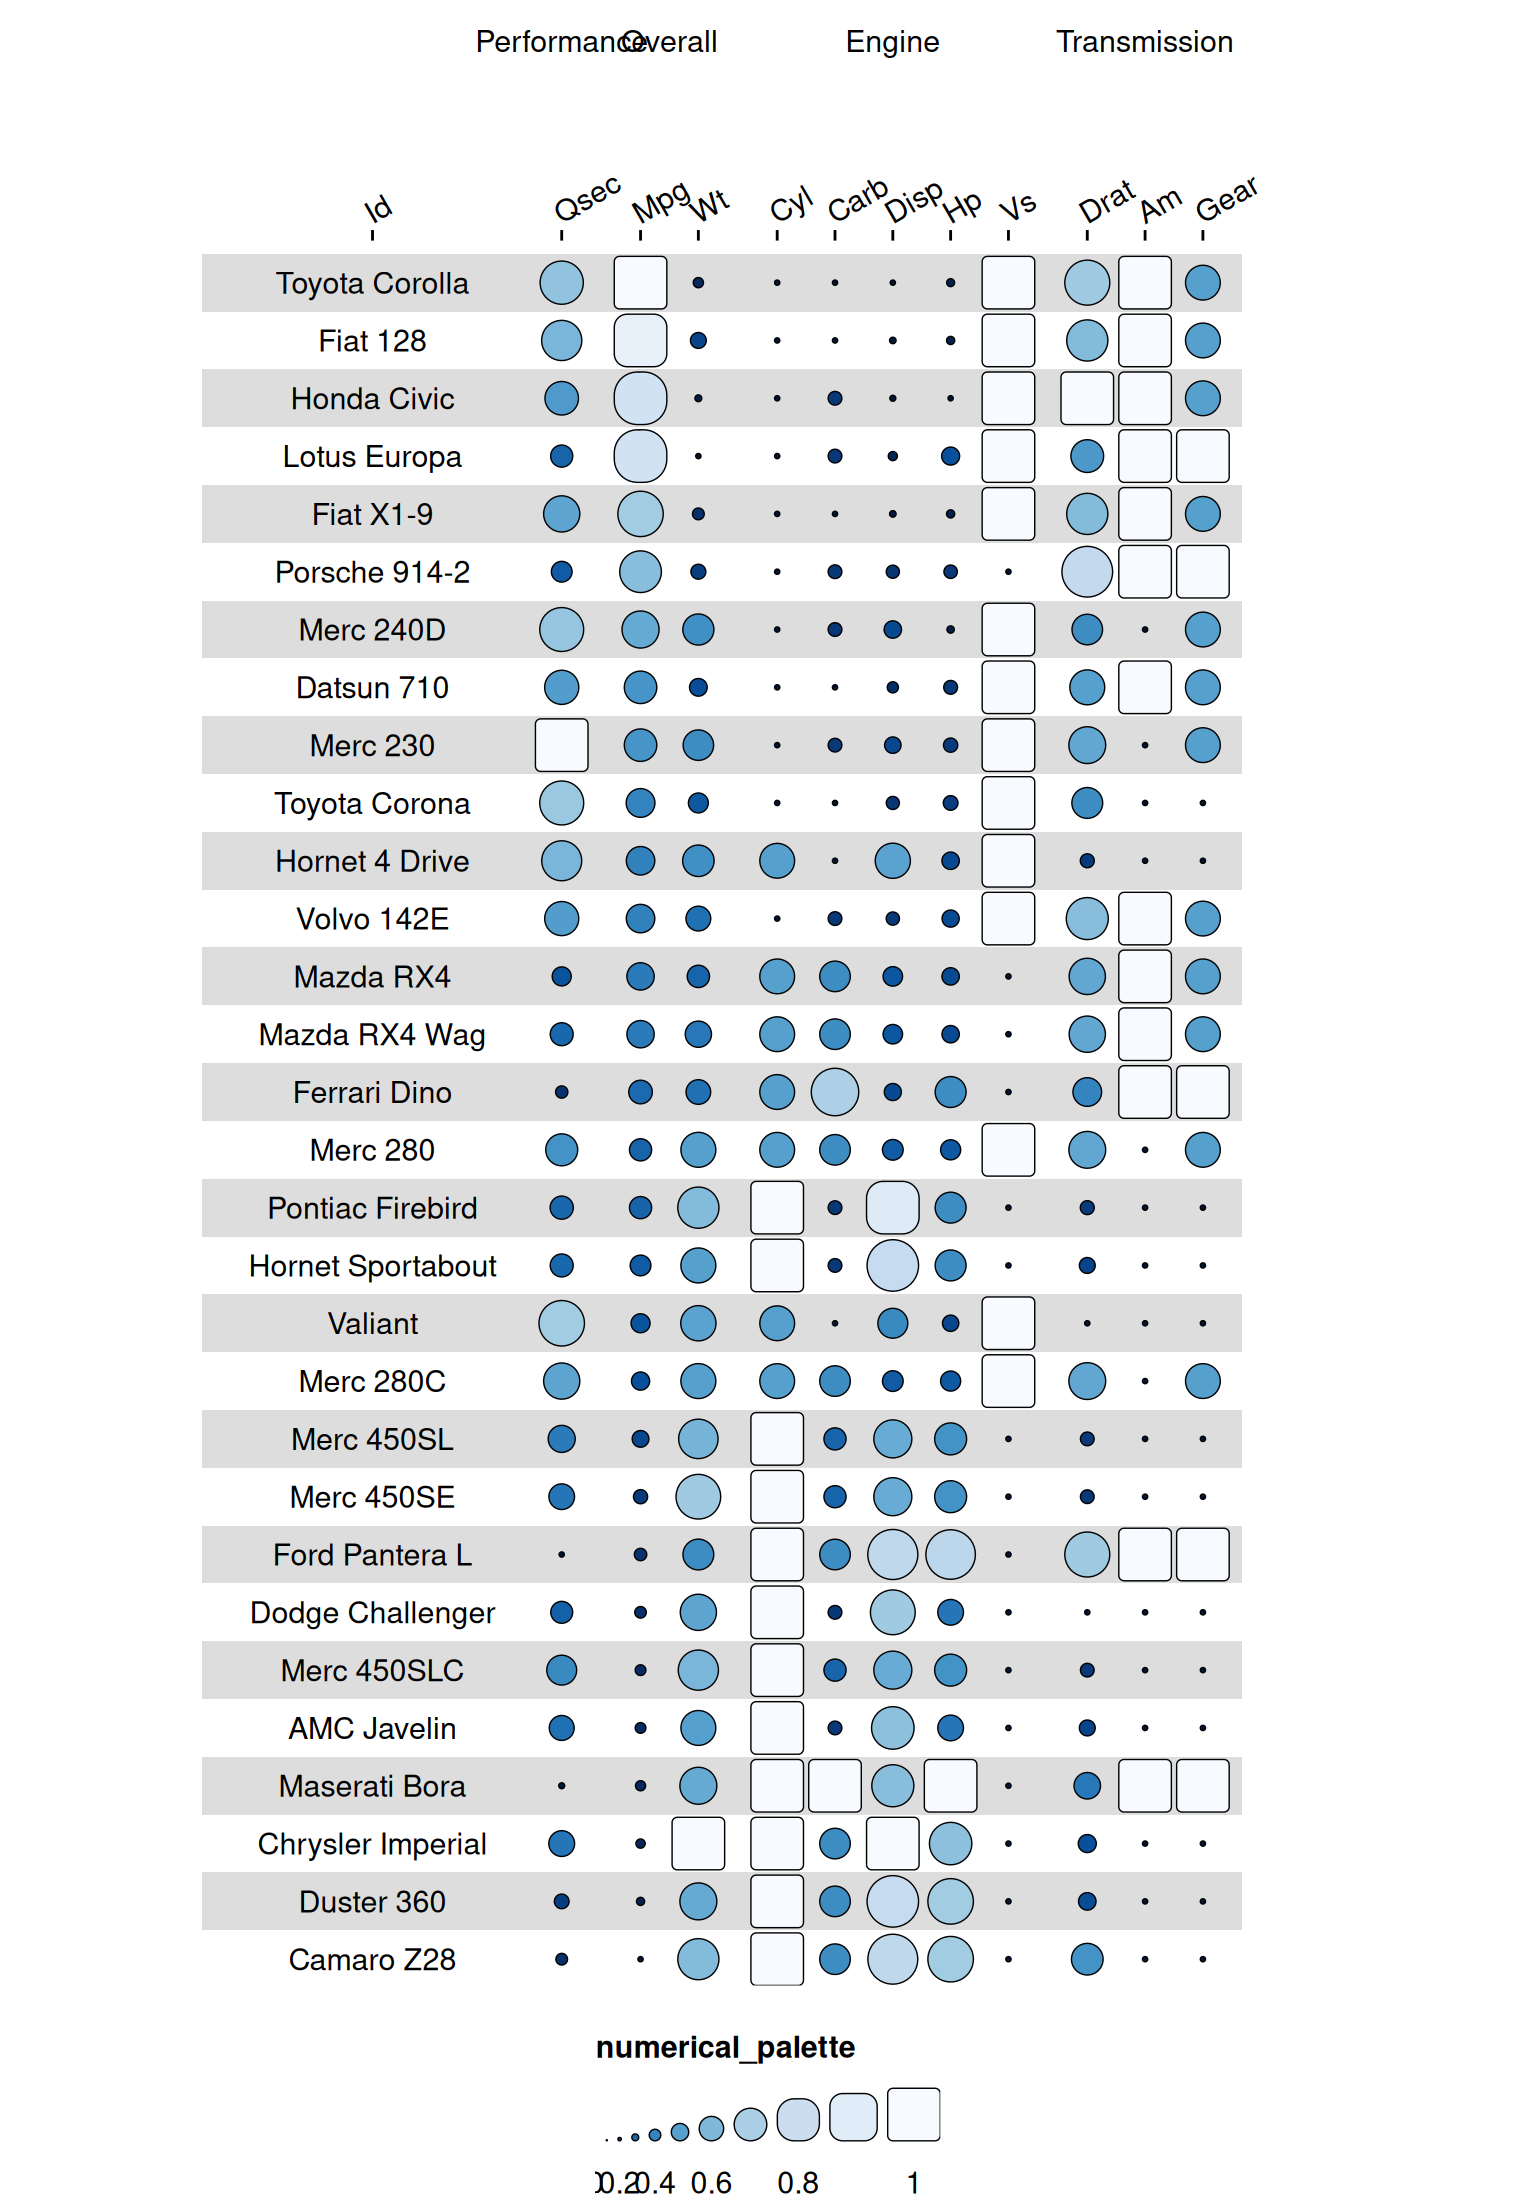
We should probably also add a name column, to make the
column labels more informative.
cinfo$name <- c("Model", "1/4 mile time", "Miles per gallon", "Weight", "Number of cylinders", "Carburetors", "Displacement", "Horsepower", "Engine type", "Rear axle ratio", "Transmission", "Forward gears")
funky_heatmap(data, column_info = cinfo)
#> ℹ Column info did not contain information on which columns to plot, inferring from `data` types.
#> ℹ Column info did not contain a column called 'palette', generating palettes based on the 'geom' column.
#> ℹ Column info did not contain a column called 'width', generating options based on the 'geom' column.
#> ℹ Column info did not contain a column called 'legend', generating options based on the 'geom' column.
#> ℹ No row info was provided, assuming all rows in `data` are to be plotted.
#> ℹ Row info did not contain group information, assuming rows are ungrouped.
#> ℹ No column groups was provided, deriving from column info.
#> ℹ Column groups did not contain a column called 'palette'. Assuming no colour scales need to be used.
#> ℹ Column groups did not contain a column called 'level1'. Using `column_info$group` as a makeshift column group name.
#> ℹ No palettes were provided, trying to automatically assign palettes.
#> ℹ Palette named 'numerical_palette' was not defined. Assuming palette is numerical. Automatically selected palette 'Blues'.
#> ℹ No legends were provided, trying to automatically infer legends.
#> ℹ Some palettes were not used in the column info, adding legends for them.
#> ℹ Legend 1 did not contain a geom, inferring from the column info.
#> ℹ Legend 1 did not contain labels, inferring from the geom.
#> ℹ Legend 1 did not contain size, inferring from the labels.
#> ℹ Legend 1 did not contain color, inferring from the palette.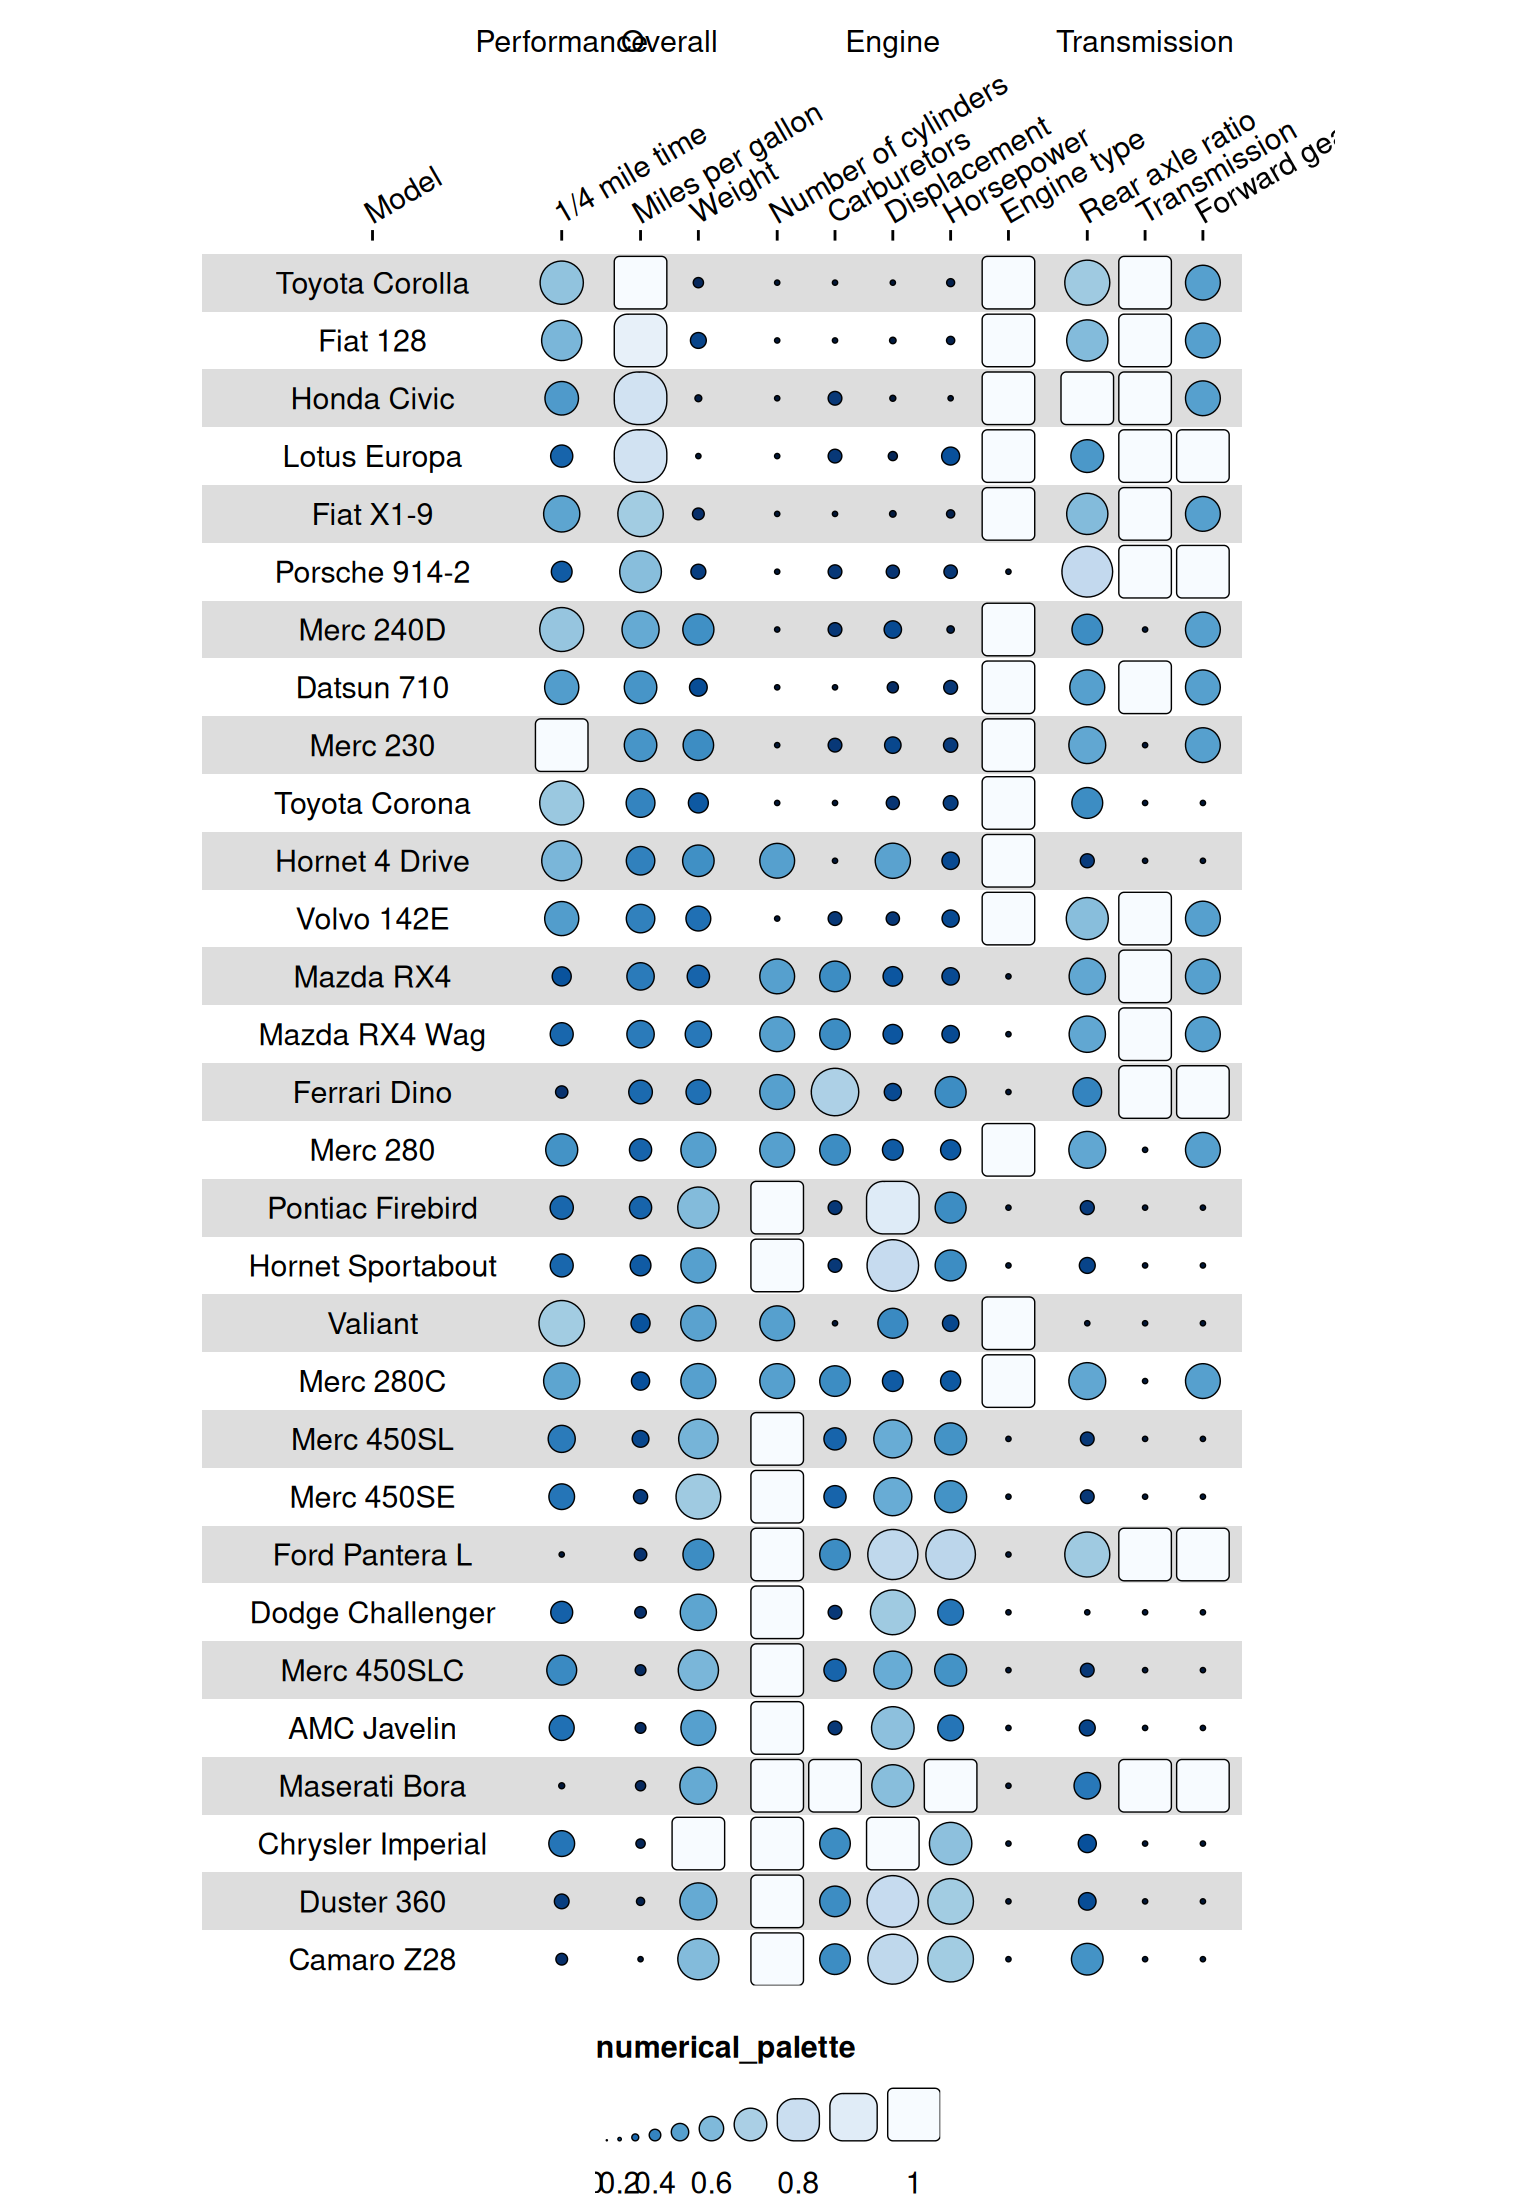
This is better, we can at least read the column groups now. However,
the column groups are not very clear: we can add a palette
column to the column_info dataframe to make the column
groups more visually distinct.
Adding palettes
Just adding a palette column is not good enough: we need
to specify a separate palette list as well. The easiest way to do this
is by creating a named list of palettes, where the names correspond to
the values in the palette column of the
column_info dataframe and use one of the predefined
palettes. These are:
for numerical data: - Blues - Reds -
Greens - YlOrBr - Greys
and for categorical data: - Set1 - Set2 -
Set3 - Dark2
cinfo$palette <- c(NA, "perf_palette", rep("overall_palette", 2), rep("engine_palette", 5), rep("transmission_palette", 3))

palettes <- list(perf_palette = "Blues", overall_palette = "Greens", engine_palette = "YlOrBr", transmission_palette = "Reds")

funky_heatmap(data, column_info = cinfo, palettes = palettes)
#> ℹ Column info did not contain information on which columns to plot, inferring from `data` types.
#> ℹ Column info did not contain a column called 'width', generating options based on the 'geom' column.
#> ℹ Column info did not contain a column called 'legend', generating options based on the 'geom' column.
#> ℹ No row info was provided, assuming all rows in `data` are to be plotted.
#> ℹ Row info did not contain group information, assuming rows are ungrouped.
#> ℹ No column groups was provided, deriving from column info.
#> ℹ Column groups did not contain a column called 'palette'. Assuming no colour scales need to be used.
#> ℹ Column groups did not contain a column called 'level1'. Using `column_info$group` as a makeshift column group name.
#> ℹ No legends were provided, trying to automatically infer legends.
#> ℹ Some palettes were not used in the column info, adding legends for them.
#> ℹ Legend 1 did not contain a geom, inferring from the column info.
#> ℹ Legend 1 did not contain labels, inferring from the geom.
#> ℹ Legend 1 did not contain size, inferring from the labels.
#> ℹ Legend 1 did not contain color, inferring from the palette.
#> ℹ Legend 2 did not contain a geom, inferring from the column info.
#> ℹ Legend 2 did not contain labels, inferring from the geom.
#> ℹ Legend 2 did not contain size, inferring from the labels.
#> ℹ Legend 2 did not contain color, inferring from the palette.
#> ℹ Legend 3 did not contain a geom, inferring from the column info.
#> ℹ Legend 3 did not contain labels, inferring from the geom.
#> ℹ Legend 3 did not contain size, inferring from the labels.
#> ℹ Legend 3 did not contain color, inferring from the palette.
#> ℹ Legend 4 did not contain a geom, inferring from the column info.
#> ℹ Legend 4 did not contain labels, inferring from the geom.
#> ℹ Legend 4 did not contain size, inferring from the labels.
#> ℹ Legend 4 did not contain color, inferring from the palette.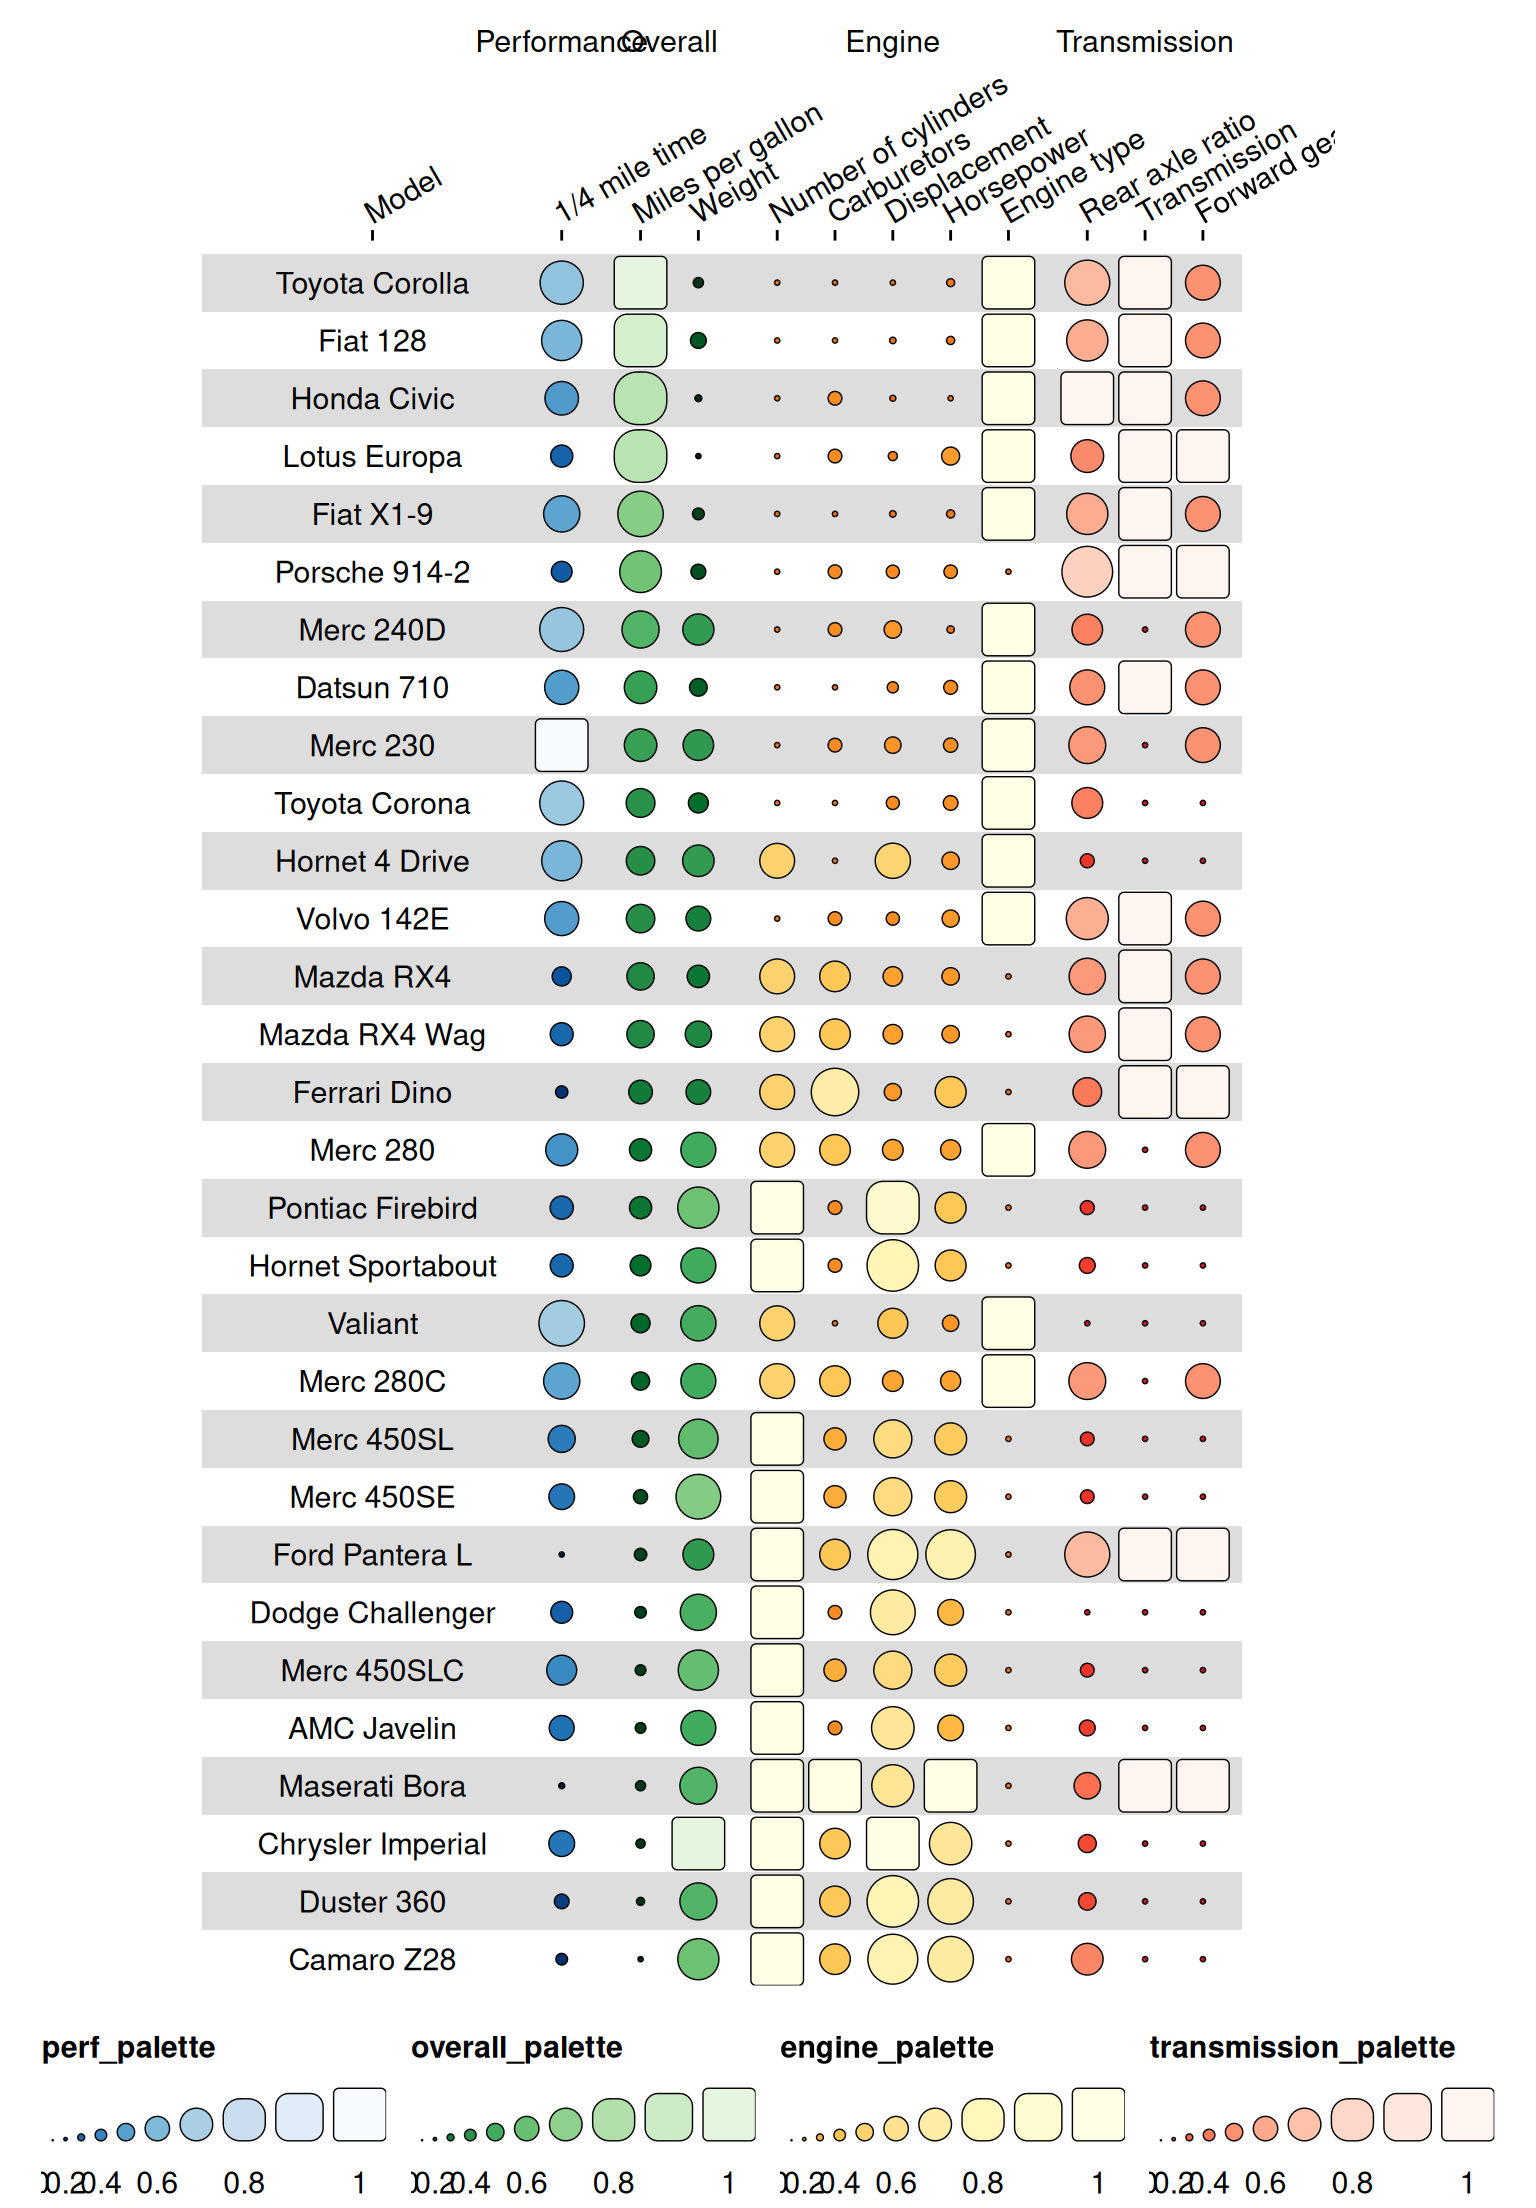
Adding column_groups
That’s already a lot more visually distinct! It would be nice if we
could color the names of the column groups as well. We can do that by
adding a column_group tibble or dataframe. It must have the
following columns: - Category (character): the name of the
column group that will be displayd - group (character): the
group that the column group belongs to. This should correspond to the
group label in the column_info dataframe -
palette (character): the palette to use for the column
group.
column_groups <- tibble(
  Category = c("Performance", "Overall", "Engine", "Transmission"),
  group = c("Performance", "Overall", "Engine", "Transmission"),
  palette = c("perf_palette", "overall_palette", "engine_palette", "transmission_palette")
)

funky_heatmap(data, column_info = cinfo, column_groups = column_groups, palettes = palettes)
#> ℹ Column info did not contain information on which columns to plot, inferring from `data` types.
#> ℹ Column info did not contain a column called 'width', generating options based on the 'geom' column.
#> ℹ Column info did not contain a column called 'legend', generating options based on the 'geom' column.
#> ℹ No row info was provided, assuming all rows in `data` are to be plotted.
#> ℹ Row info did not contain group information, assuming rows are ungrouped.
#> ℹ No legends were provided, trying to automatically infer legends.
#> ℹ Some palettes were not used in the column info, adding legends for them.
#> ℹ Legend 1 did not contain a geom, inferring from the column info.
#> ℹ Legend 1 did not contain labels, inferring from the geom.
#> ℹ Legend 1 did not contain size, inferring from the labels.
#> ℹ Legend 1 did not contain color, inferring from the palette.
#> ℹ Legend 2 did not contain a geom, inferring from the column info.
#> ℹ Legend 2 did not contain labels, inferring from the geom.
#> ℹ Legend 2 did not contain size, inferring from the labels.
#> ℹ Legend 2 did not contain color, inferring from the palette.
#> ℹ Legend 3 did not contain a geom, inferring from the column info.
#> ℹ Legend 3 did not contain labels, inferring from the geom.
#> ℹ Legend 3 did not contain size, inferring from the labels.
#> ℹ Legend 3 did not contain color, inferring from the palette.
#> ℹ Legend 4 did not contain a geom, inferring from the column info.
#> ℹ Legend 4 did not contain labels, inferring from the geom.
#> ℹ Legend 4 did not contain size, inferring from the labels.
#> ℹ Legend 4 did not contain color, inferring from the palette.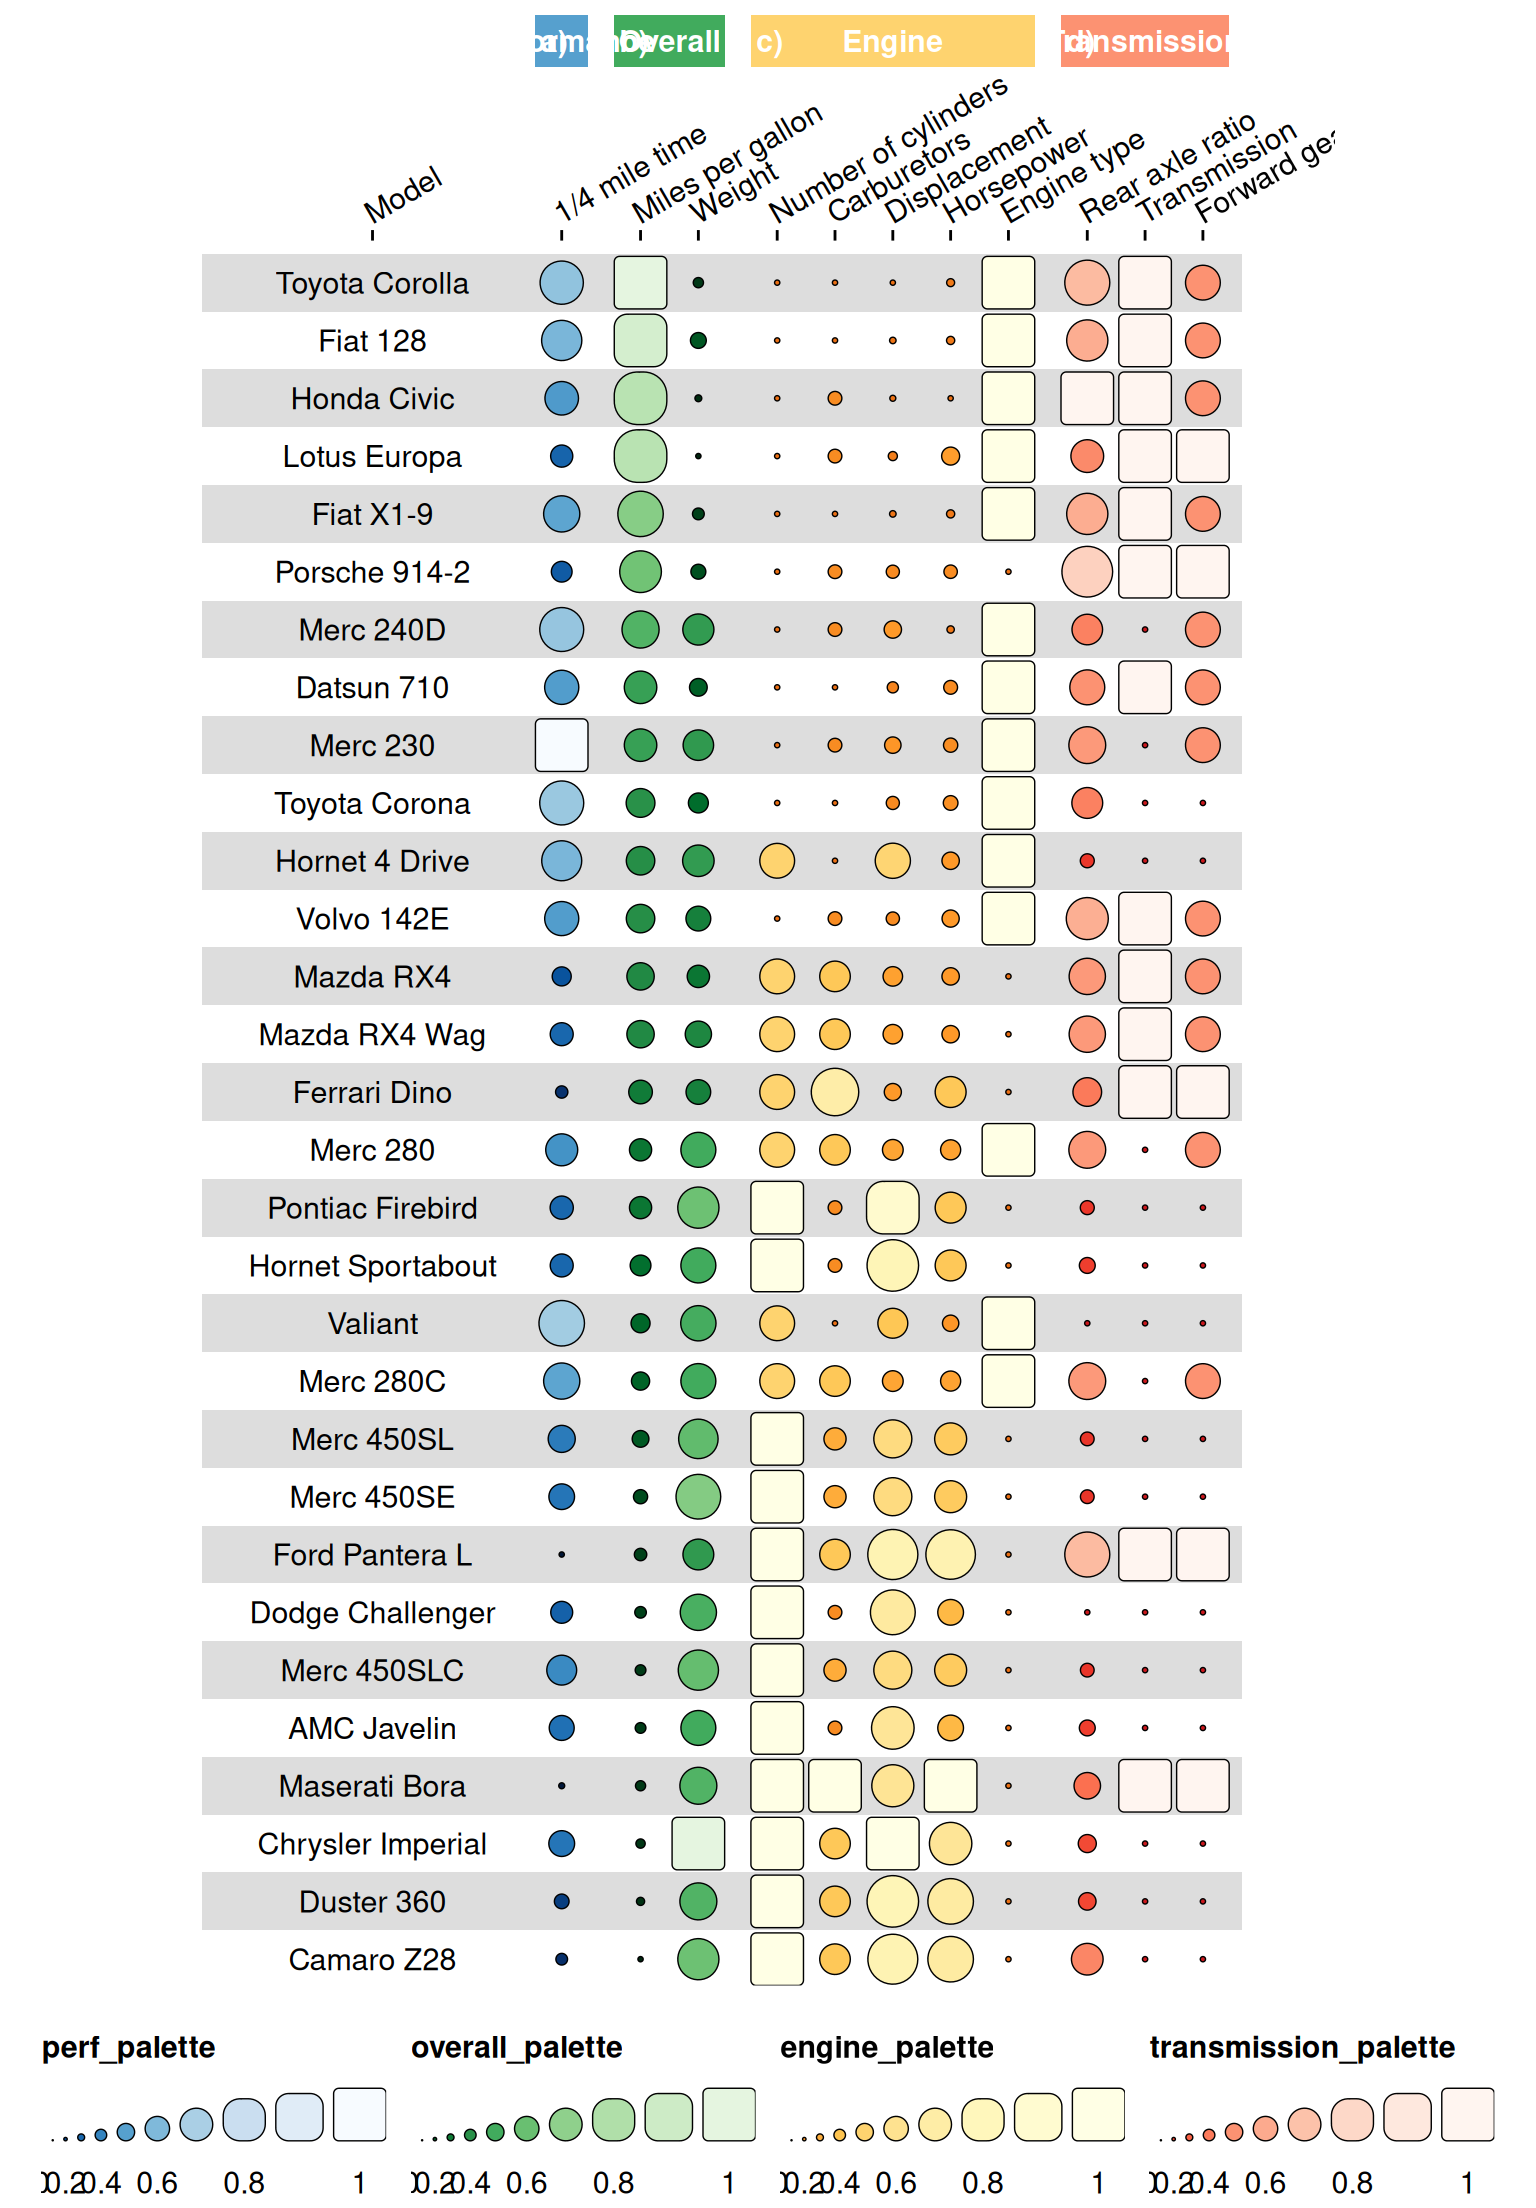
Specifying geoms
It makes sense for some of the information to be presented in a different way. For instance, the number of cylinders and the number of carburetors are discrete values, so it would make sense to display them as rectangles with a text overlay.
cinfo$geom <- c("text", "bar", "bar", "bar", "rect", "rect", "funkyrect", "funkyrect", "circle", "funkyrect", "rect", "rect")
funky_heatmap(data, column_info = cinfo, column_groups = column_groups, palettes = palettes)
#> ℹ Column info did not contain a column called 'width', generating options based on the 'geom' column.
#> ℹ Column info did not contain a column called 'legend', generating options based on the 'geom' column.
#> ℹ No row info was provided, assuming all rows in `data` are to be plotted.
#> ℹ Row info did not contain group information, assuming rows are ungrouped.
#> ℹ No legends were provided, trying to automatically infer legends.
#> ℹ Some palettes were not used in the column info, adding legends for them.
#> ℹ Legend 1 did not contain a geom, inferring from the column info.
#> ℹ Legend 1 did not contain labels, inferring from the geom.
#> ℹ Legend 1 did not contain color, inferring from the palette.
#> ℹ Legend 2 did not contain a geom, inferring from the column info.
#> ℹ Legend 2 did not contain labels, inferring from the geom.
#> ℹ Legend 2 did not contain color, inferring from the palette.
#> ℹ Legend 3 did not contain a geom, inferring from the column info.
#> ℹ Legend 3 did not contain labels, inferring from the geom.
#> ℹ Legend 3 did not contain size, inferring from the labels.
#> ℹ Legend 3 did not contain color, inferring from the palette.
#> ℹ Legend 4 did not contain a geom, inferring from the column info.
#> ℹ Legend 4 did not contain labels, inferring from the geom.
#> ℹ Legend 4 did not contain size, inferring from the labels.
#> ℹ Legend 4 did not contain color, inferring from the palette.
#> Scale for fill is already present.
#> Adding another scale for fill, which will replace the existing scale.
#> Scale for fill is already present.
#> Adding another scale for fill, which will replace the existing scale.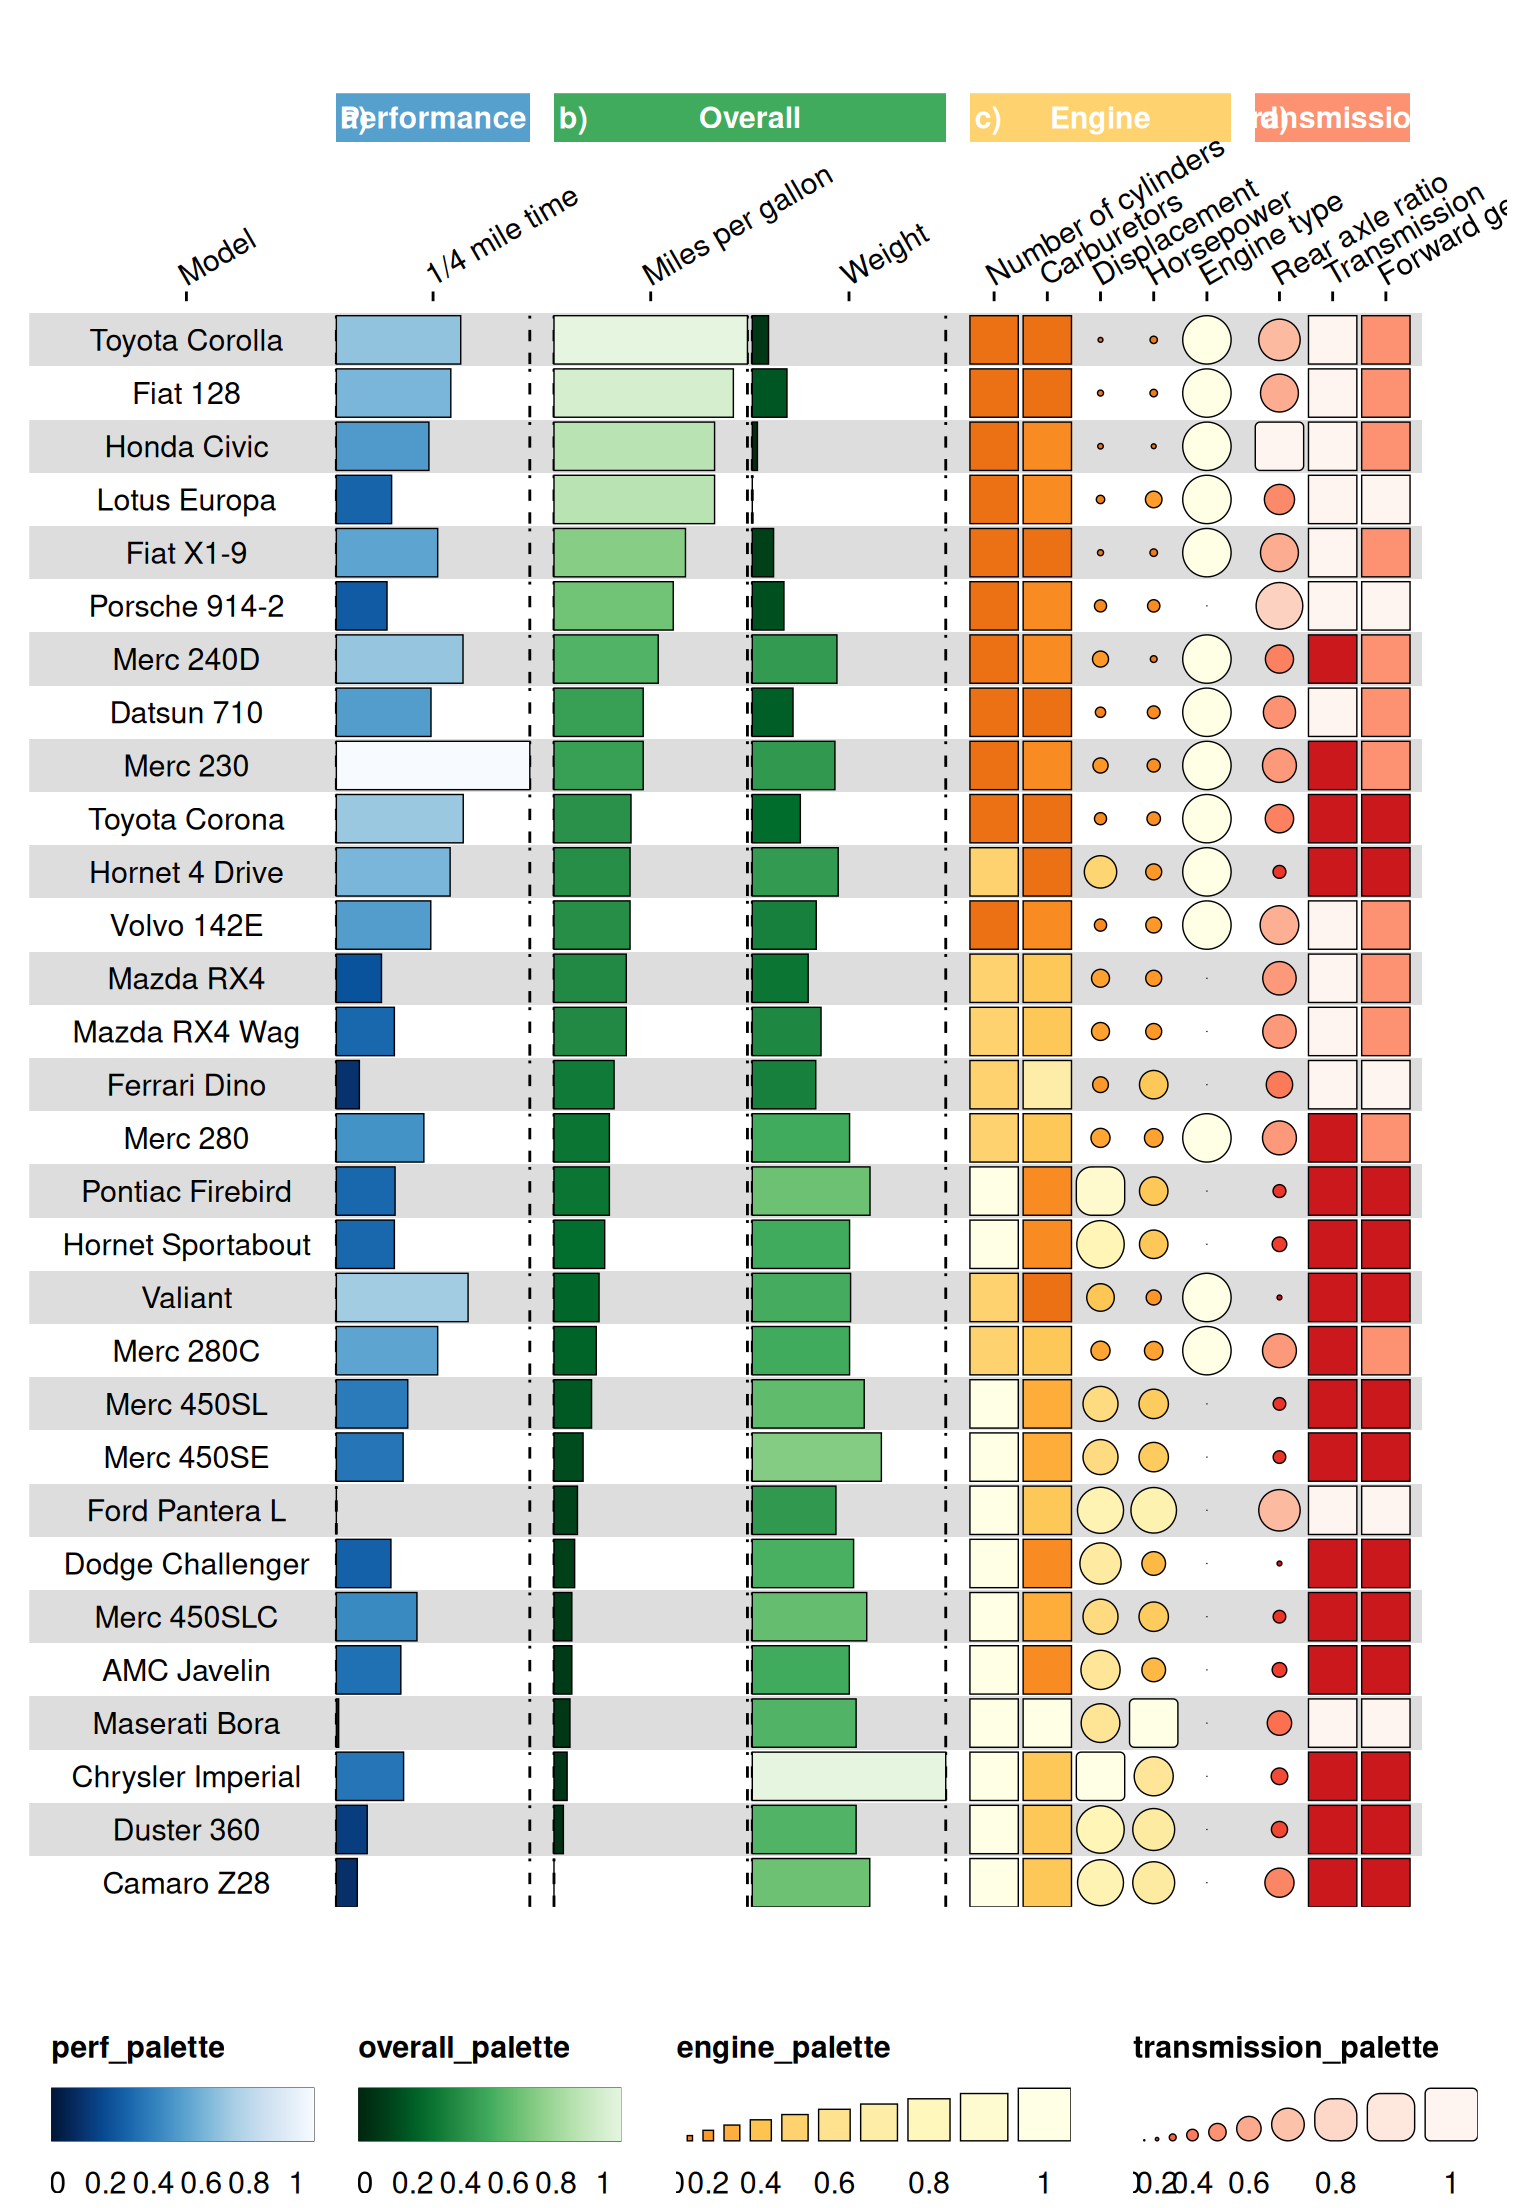
This looks nice, but we don’t have the text overlay yet.
# column_info$options <- lapply(seq(12), function(x) lst())
cinfo <- cinfo %>%
  add_row(id = "cyl", group = "Engine", name = "", geom = "text", options = lst(lst(overlay = TRUE)), palette = "black", .before = 6) %>%
  add_row(id = "carb", group = "Engine", name = "", geom = "text", options = lst(lst(overlay = TRUE)), palette = "black", .before = 8) %>%
  add_row(id = "am", group = "Transmission", name = "", geom = "text", options = lst(lst(overlay = TRUE)), palette = "black", .before = 14) %>%
  add_row(id = "gear", group = "Transmission", name = "", geom = "text", options = lst(lst(overlay = TRUE)), palette = "black", .before = 17)

cinfo
#> # A tibble: 16 × 6
#>    id    group        options          name                  palette       geom
#>    <chr> <chr>        <named list>     <chr>                 <chr>         <chr>
#>  1 id    NA           <named list [0]> "Model"               NA            text
#>  2 qsec  Performance  <named list [0]> "1/4 mile time"       perf_palette  bar
#>  3 mpg   Overall      <named list [0]> "Miles per gallon"    overall_pale… bar
#>  4 wt    Overall      <named list [0]> "Weight"              overall_pale… bar
#>  5 cyl   Engine       <named list [0]> "Number of cylinders" engine_palet… rect
#>  6 cyl   Engine       <named list [1]> ""                    black         text
#>  7 carb  Engine       <named list [0]> "Carburetors"         engine_palet… rect
#>  8 carb  Engine       <named list [1]> ""                    black         text
#>  9 disp  Engine       <named list [0]> "Displacement"        engine_palet… funk…
#> 10 hp    Engine       <named list [0]> "Horsepower"          engine_palet… funk…
#> 11 vs    Engine       <named list [0]> "Engine type"         engine_palet… circ…
#> 12 drat  Transmission <named list [0]> "Rear axle ratio"     transmission… funk…
#> 13 am    Transmission <named list [0]> "Transmission"        transmission… rect
#> 14 am    Transmission <named list [1]> ""                    black         text
#> 15 gear  Transmission <named list [0]> "Forward gears"       transmission… rect
#> 16 gear  Transmission <named list [1]> ""                    black         text

palettes$black <- c(rep("black", 2))
funky_heatmap(data, column_info = cinfo, column_groups = column_groups, palettes = palettes)
#> ℹ Column info did not contain a column called 'width', generating options based on the 'geom' column.
#> ℹ Column info did not contain a column called 'legend', generating options based on the 'geom' column.
#> ℹ No row info was provided, assuming all rows in `data` are to be plotted.
#> ℹ Row info did not contain group information, assuming rows are ungrouped.
#> ℹ No legends were provided, trying to automatically infer legends.
#> ℹ Some palettes were not used in the column info, adding legends for them.
#> ℹ Legend 1 did not contain a geom, inferring from the column info.
#> ℹ Legend 1 did not contain labels, inferring from the geom.
#> ℹ Legend 1 did not contain color, inferring from the palette.
#> ℹ Legend 2 did not contain a geom, inferring from the column info.
#> ℹ Legend 2 did not contain labels, inferring from the geom.
#> ℹ Legend 2 did not contain color, inferring from the palette.
#> ℹ Legend 3 did not contain a geom, inferring from the column info.
#> ℹ Legend 3 did not contain labels, inferring from the geom.
#> ℹ Legend 3 did not contain size, inferring from the labels.
#> ℹ Legend 3 did not contain color, inferring from the palette.
#> ℹ Legend 4 did not contain a geom, inferring from the column info.
#> ℹ Legend 4 did not contain labels, inferring from the geom.
#> ! Legend 4 has geom text but no specified labels, so disabling this legend for now.
#> ℹ Legend 5 did not contain a geom, inferring from the column info.
#> ℹ Legend 5 did not contain labels, inferring from the geom.
#> ℹ Legend 5 did not contain size, inferring from the labels.
#> ℹ Legend 5 did not contain color, inferring from the palette.
#> Scale for fill is already present.
#> Adding another scale for fill, which will replace the existing scale.
#> Scale for fill is already present.
#> Adding another scale for fill, which will replace the existing scale.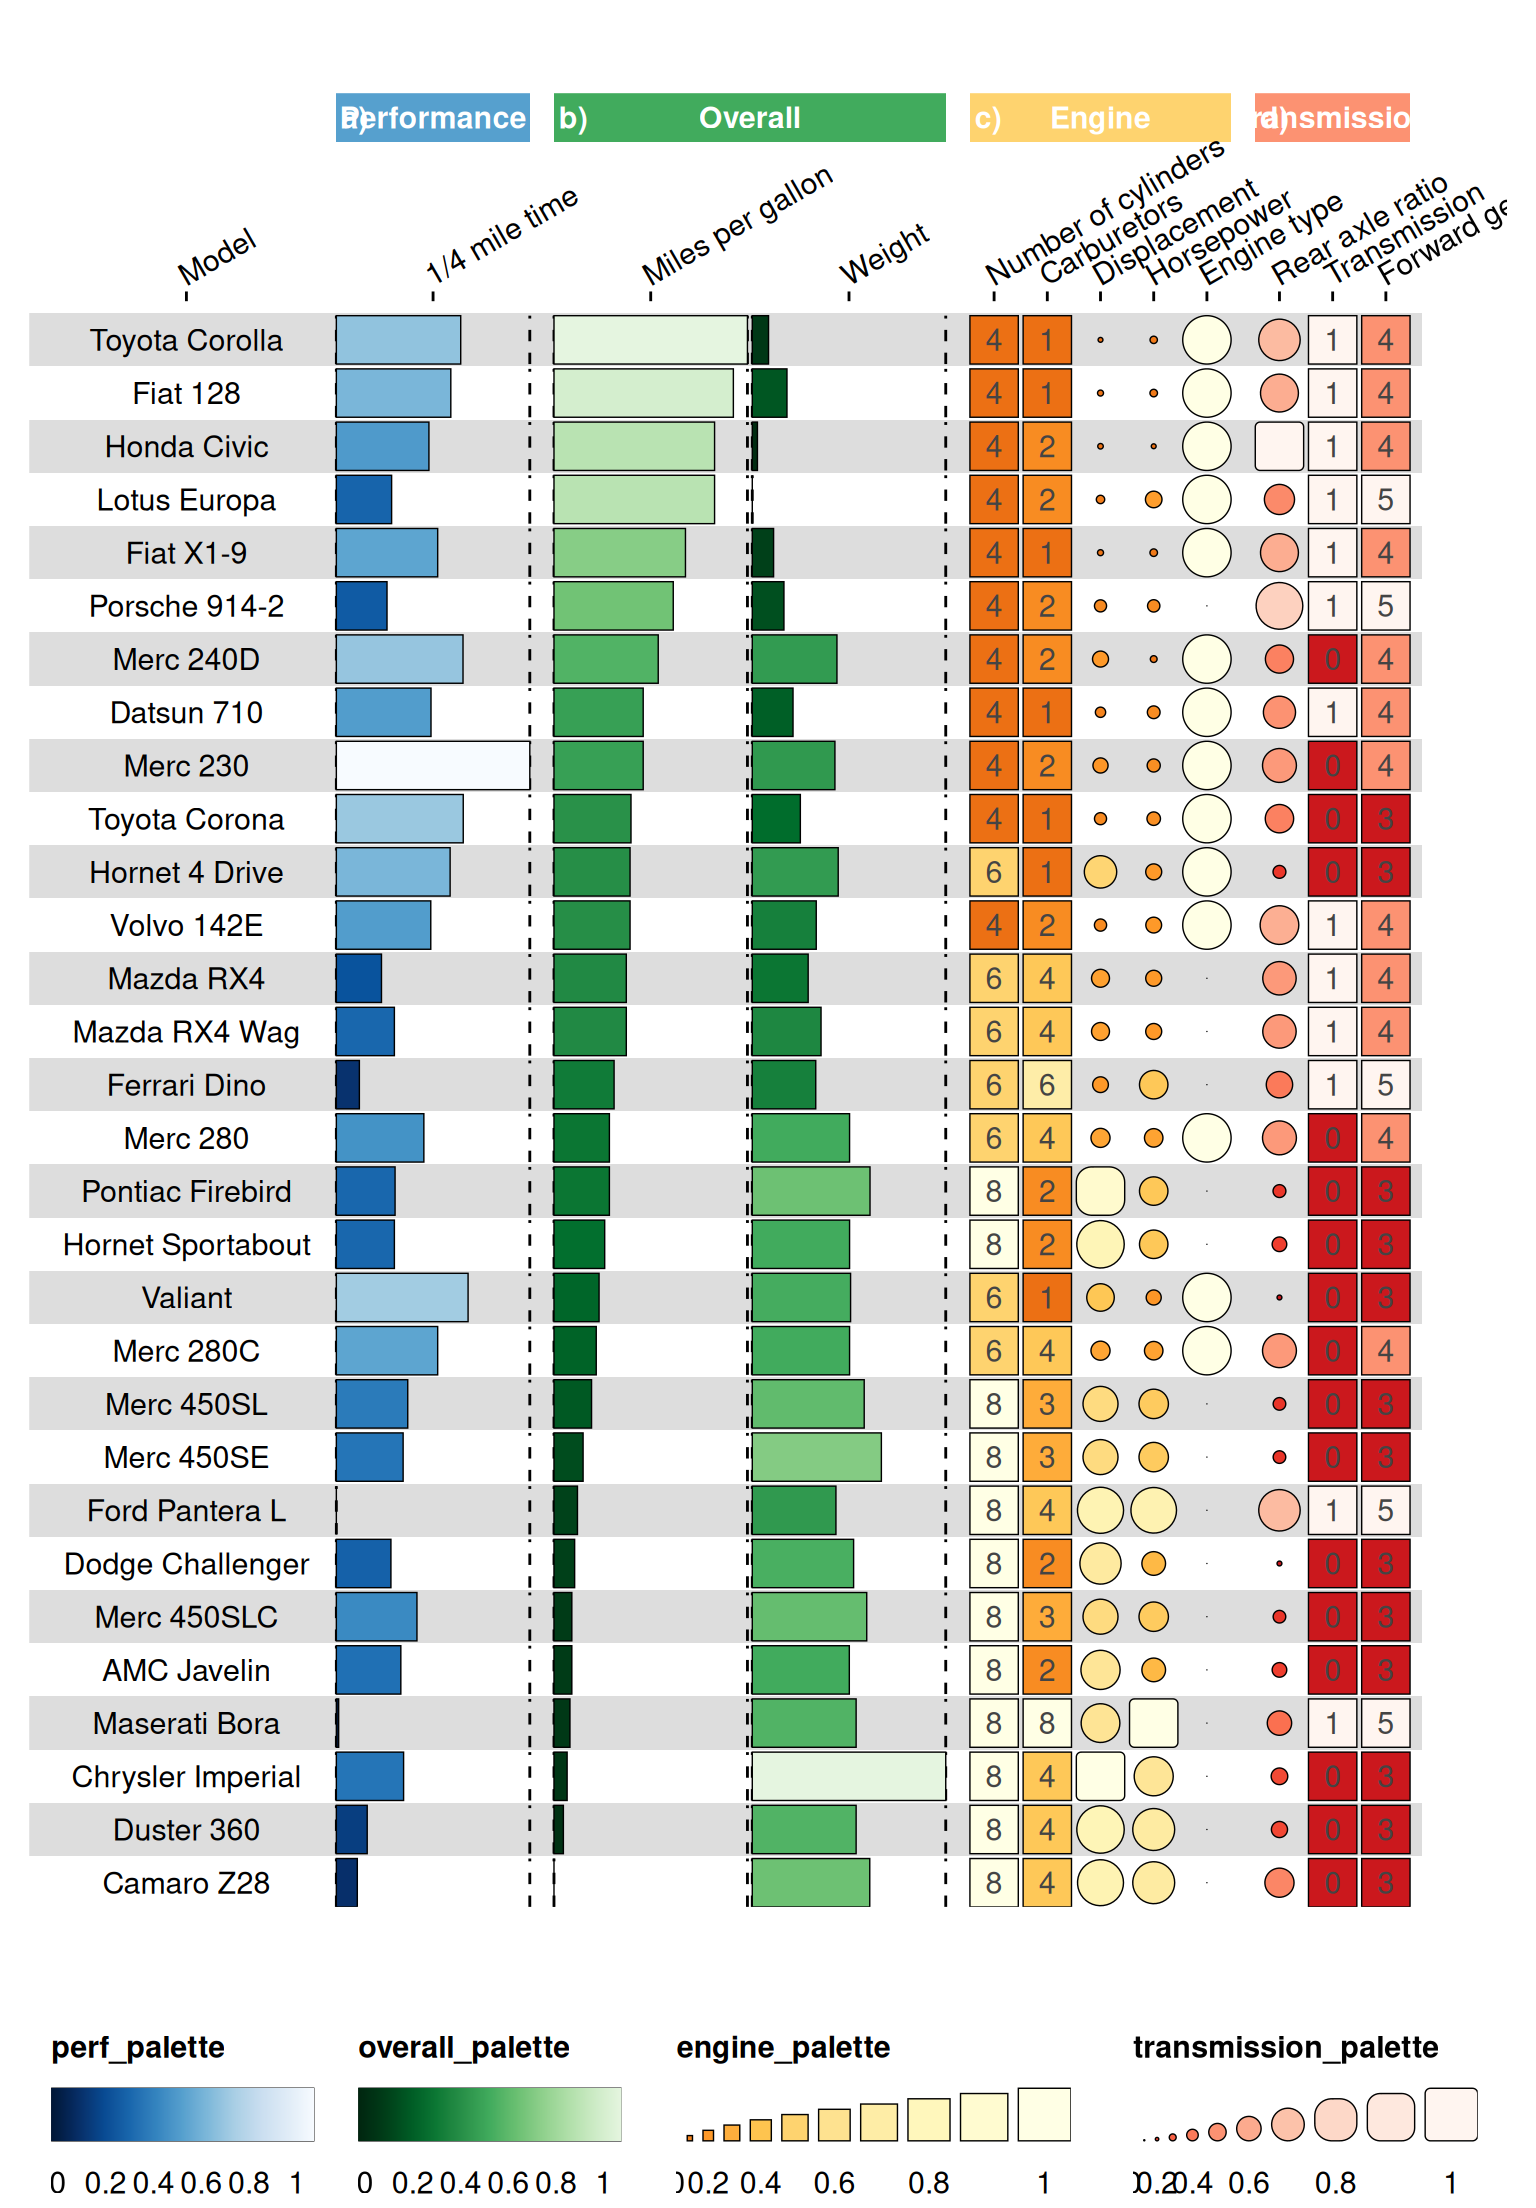
This is starting to look like a nice visualisation!
Customising legends
We can also customise the legends for the different columns. If we
want multiple legends for a single palette, we just need to specify
multiple entries in the legends list for that palette.
palettes$funky_palette_grey <- RColorBrewer::brewer.pal(9, "Greys")[-1] %>% rev()

legends <- list(
    list(
        palette = "perf_palette",
        geom = "bar",
        title = "1/4 mile time",
        labels = c(paste0(min(data$qsec), "s"), rep("", 8), paste0(max(data$qsec), "s"))
    ),
    list(
        palette = "overall_palette",
        geom = "bar",
        title = "Miles per gallon",
        labels = c(paste0(min(data$mpg), "mpg"), rep("", 8), paste0(max(data$mpg), "mpg"))
    ),
    list(
        palette = "overall_palette",
        geom = "bar",
        title = "Weight",
        labels = c(paste0(min(data$wt), "lbs"), rep("", 8), paste0(max(data$wt), "lbs"))
    ),
    list(
        palette = "funky_palette_grey",
        geom = "funkyrect",
        title = "Overall",
        enabled = TRUE,
        labels = c("0", "", "0.2", "", "0.4", "", "0.6", "", "0.8", "", "1")
    )
)
funky_heatmap(data, column_info = cinfo, column_groups = column_groups, palettes = palettes, legends = legends)
#> ℹ Column info did not contain a column called 'width', generating options based on the 'geom' column.
#> ℹ Column info did not contain a column called 'legend', generating options based on the 'geom' column.
#> ℹ No row info was provided, assuming all rows in `data` are to be plotted.
#> ℹ Row info did not contain group information, assuming rows are ungrouped.
#> ℹ Some palettes were not used in the column info, adding legends for them.
#> ℹ Legend 1 did not contain color, inferring from the palette.
#> ℹ Legend 2 did not contain color, inferring from the palette.
#> ℹ Legend 3 did not contain color, inferring from the palette.
#> ℹ Legend 4 did not contain size, inferring from the labels.
#> ℹ Legend 4 did not contain color, inferring from the palette.
#> ℹ Legend 5 did not contain a geom, inferring from the column info.
#> ℹ Legend 5 did not contain labels, inferring from the geom.
#> ℹ Legend 5 did not contain size, inferring from the labels.
#> ℹ Legend 5 did not contain color, inferring from the palette.
#> ℹ Legend 6 did not contain a geom, inferring from the column info.
#> ℹ Legend 6 did not contain labels, inferring from the geom.
#> ! Legend 6 has geom text but no specified labels, so disabling this legend for now.
#> ℹ Legend 7 did not contain a geom, inferring from the column info.
#> ℹ Legend 7 did not contain labels, inferring from the geom.
#> ℹ Legend 7 did not contain size, inferring from the labels.
#> ℹ Legend 7 did not contain color, inferring from the palette.
#> Scale for fill is already present.
#> Adding another scale for fill, which will replace the existing scale.
#> Scale for fill is already present.
#> Adding another scale for fill, which will replace the existing scale.
#> Scale for fill is already present.
#> Adding another scale for fill, which will replace the existing scale.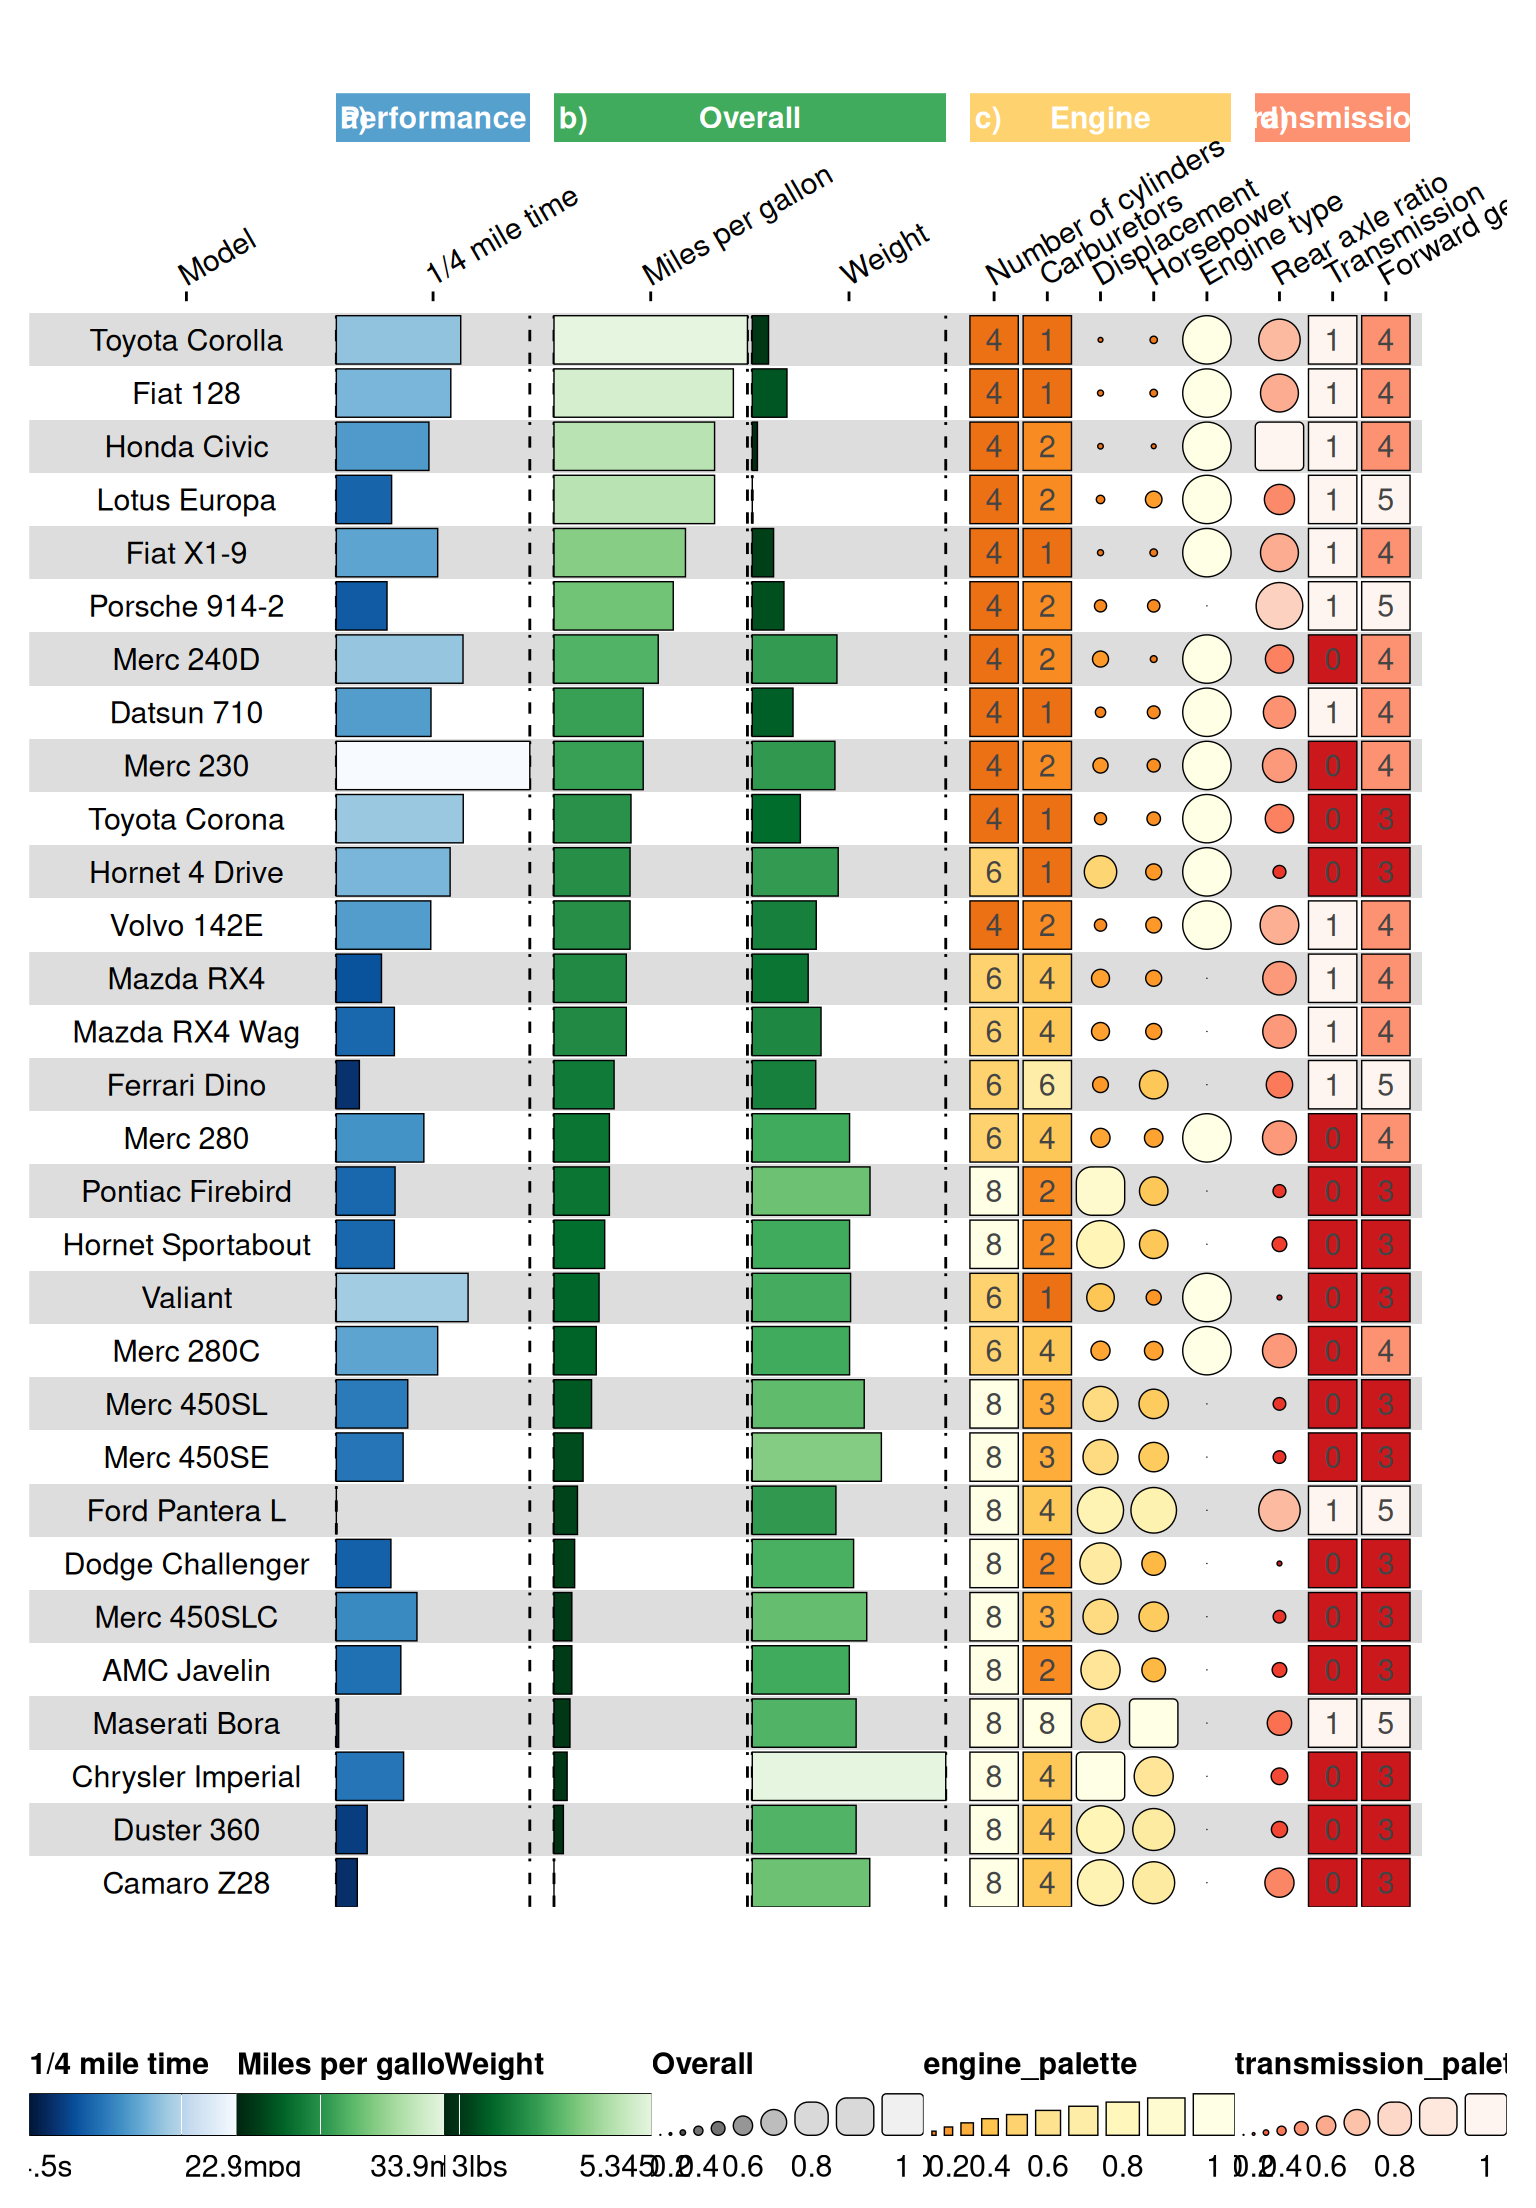
Now, we would like to disable the engine_palette and the
transmission_palette legends, as they don’t really add
extra information anymore. We can do this with the enabled
argument in legends list.
disabled_legends = list(
    list(
        palette = "engine_palette",
        enabled = FALSE
    ),
    list(
        palette = "transmission_palette",
        enabled = FALSE
    )
)

# append disabled_legends to legends
legends <- c(legends, disabled_legends)

funky_heatmap(data, column_info = cinfo, column_groups = column_groups, palettes = palettes, legends = legends)
#> ℹ Column info did not contain a column called 'width', generating options based on the 'geom' column.
#> ℹ Column info did not contain a column called 'legend', generating options based on the 'geom' column.
#> ℹ No row info was provided, assuming all rows in `data` are to be plotted.
#> ℹ Row info did not contain group information, assuming rows are ungrouped.
#> ℹ Some palettes were not used in the column info, adding legends for them.
#> ℹ Legend 1 did not contain color, inferring from the palette.
#> ℹ Legend 2 did not contain color, inferring from the palette.
#> ℹ Legend 3 did not contain color, inferring from the palette.
#> ℹ Legend 4 did not contain size, inferring from the labels.
#> ℹ Legend 4 did not contain color, inferring from the palette.
#> ℹ Legend 7 did not contain a geom, inferring from the column info.
#> ℹ Legend 7 did not contain labels, inferring from the geom.
#> ! Legend 7 has geom text but no specified labels, so disabling this legend for now.
#> Scale for fill is already present.
#> Adding another scale for fill, which will replace the existing scale.
#> Scale for fill is already present.
#> Adding another scale for fill, which will replace the existing scale.
#> Scale for fill is already present.
#> Adding another scale for fill, which will replace the existing scale.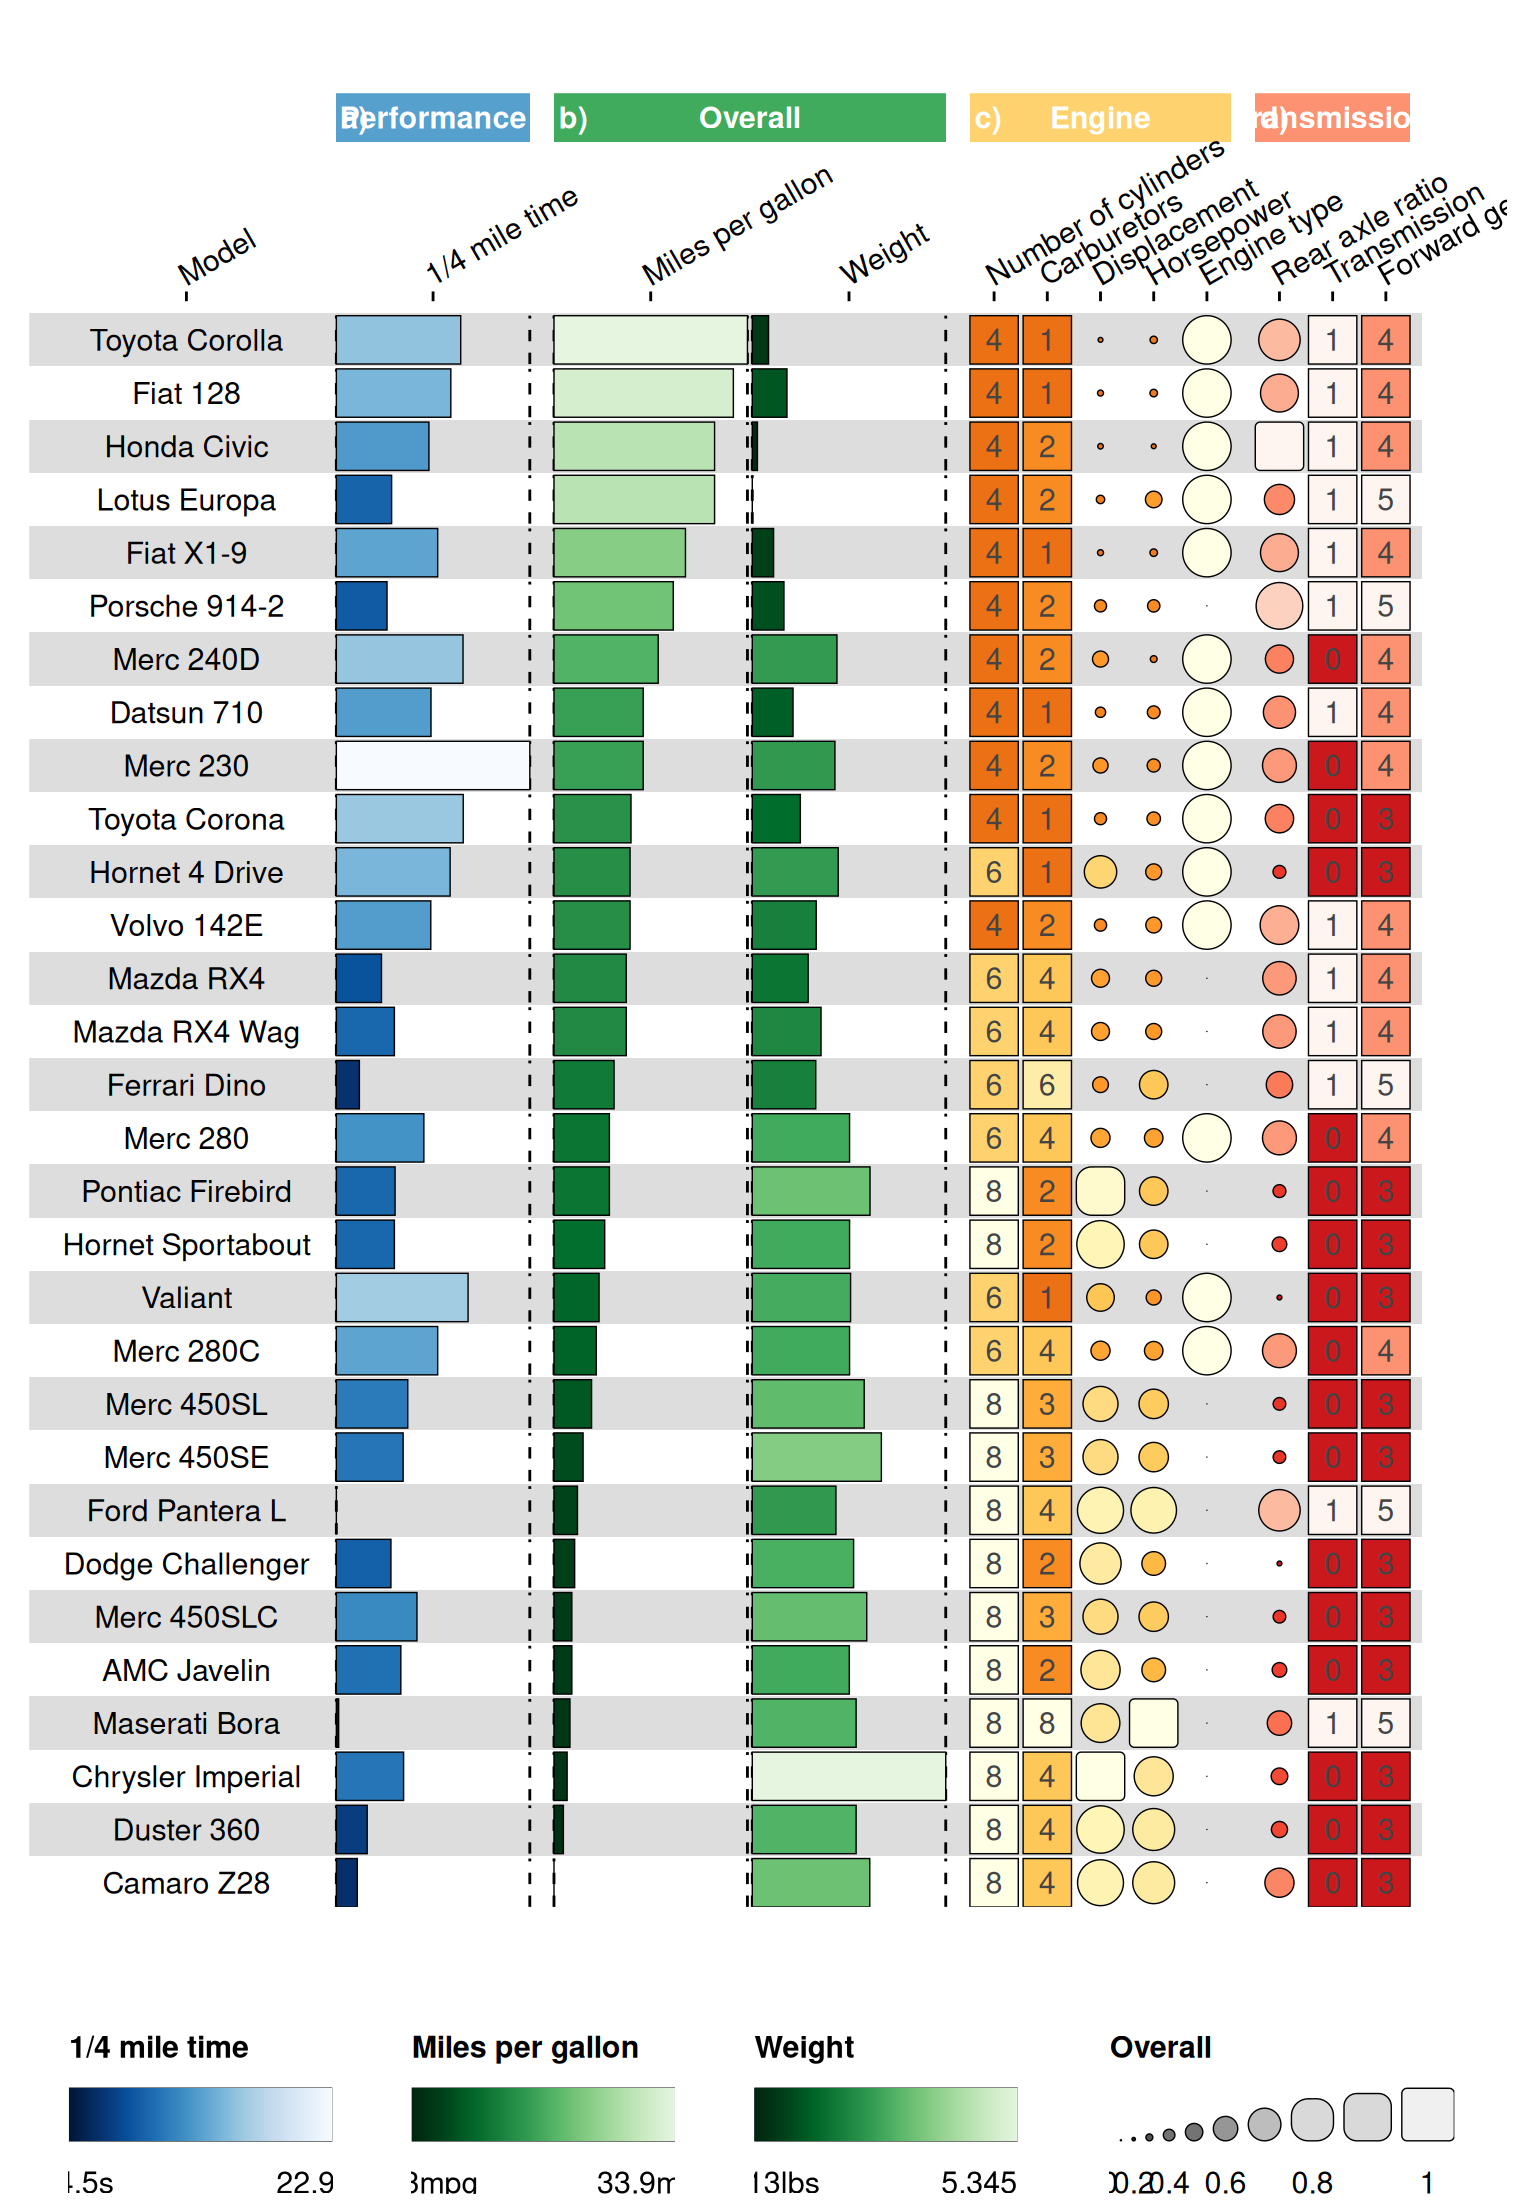
Adding images
The transmission and engine type columns
are still not very informative: they basically just contain 0 or 1, with
no information what this means. We can replace these values with images
to make it more clear. If we want to replace their values with images,
we need to specify the image locations.
First we replace their values by the image names in the actual data.
We will specify the directory and extension in the
column_info dataframe.
We also need to change the geom in
column_info to image for the columns that
should display images.
# change the am: if 0 go to "automatic", if 1 go to "manual"
data[data$am == 0, "am"] <- "automatic"
data[data$am == 1, "am"] <- "manual"

# change the vs: if 0 go to "vengine", if 1 go to "straight"
data[data$vs == 0, "vs"] <- "vengine"
data[data$vs == 1, "vs"] <- "straight"

cinfo$directory <- NA
cinfo$extension <- NA

# remove row 14
cinfo <- cinfo[-14, ]

cinfo[cinfo$id %in% c("vs", "am"), "directory"] <- "images"
cinfo[cinfo$id %in% c("vs", "am"), "extension"] <- "png"
cinfo[c(11, 13), "geom"] <- "image"

funky_heatmap(data, column_info = cinfo, column_groups = column_groups, palettes = palettes, legends = legends)
#> ℹ Column info did not contain a column called 'width', generating options based on the 'geom' column.
#> ℹ Column info did not contain a column called 'legend', generating options based on the 'geom' column.
#> ℹ No row info was provided, assuming all rows in `data` are to be plotted.
#> ℹ Row info did not contain group information, assuming rows are ungrouped.
#> ℹ Some palettes were not used in the column info, adding legends for them.
#> ℹ Legend 1 did not contain color, inferring from the palette.
#> ℹ Legend 2 did not contain color, inferring from the palette.
#> ℹ Legend 3 did not contain color, inferring from the palette.
#> ℹ Legend 4 did not contain size, inferring from the labels.
#> ℹ Legend 4 did not contain color, inferring from the palette.
#> ℹ Legend 7 did not contain a geom, inferring from the column info.
#> ℹ Legend 7 did not contain labels, inferring from the geom.
#> ! Legend 7 has geom text but no specified labels, so disabling this legend for now.
#> Scale for fill is already present.
#> Adding another scale for fill, which will replace the existing scale.
#> Scale for fill is already present.
#> Adding another scale for fill, which will replace the existing scale.
#> Scale for fill is already present.
#> Adding another scale for fill, which will replace the existing scale.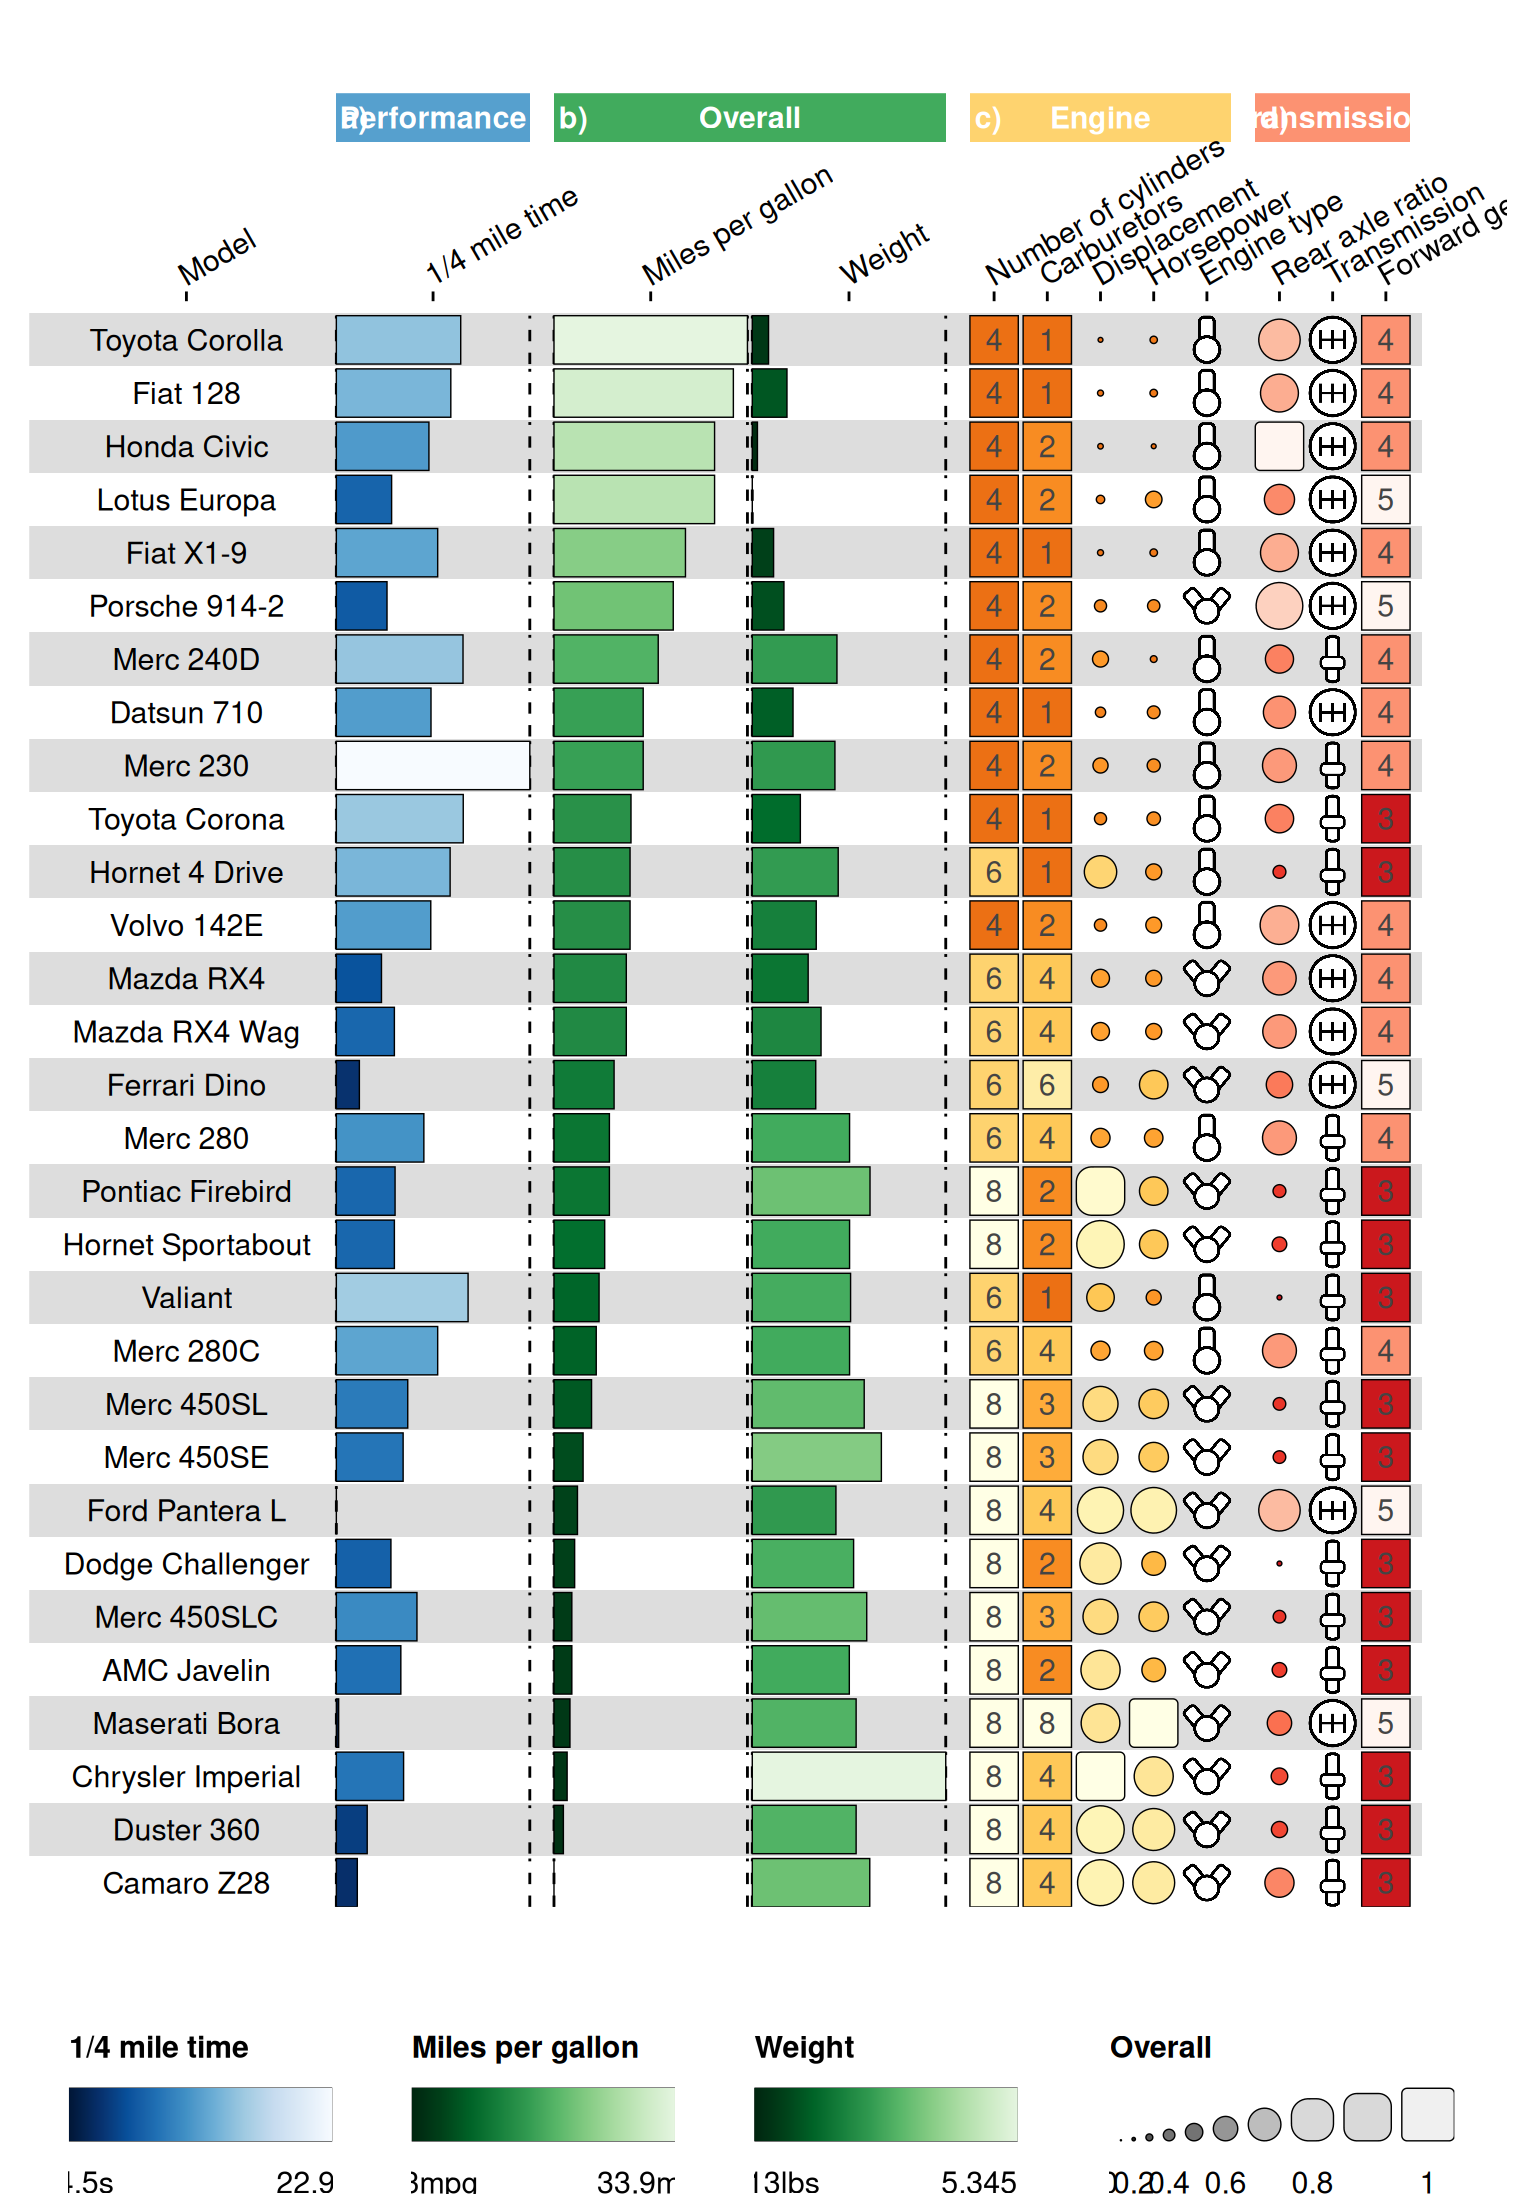
Row grouping
We can also group rows together. Let’s say that in this case we
especially want to highlight the Mercedes cars. For this, we need to
rearrange the data so that the Mercedes cars are at the top of the
dataframe. We can then add a row_info dataframe that
specifies the grouping of the rows.
row_info <- data %>% transmute(id, group = ifelse(grepl("Merc", id), "Mercedes", "Other"))
# sort Mercedes cars to the top of the data and the row_info dataframe
data <- data[order(row_info$group), ]
row_info <- row_info[order(row_info$group), ]

row_groups <- tibble(level1 = c("Mercedes", "Other cars"), group = c("Mercedes", "Other"))

funky_heatmap(data, column_info = cinfo, column_groups = column_groups, palettes = palettes, legends = legends, row_info = row_info, row_groups = row_groups)
#> ℹ Column info did not contain a column called 'width', generating options based on the 'geom' column.
#> ℹ Column info did not contain a column called 'legend', generating options based on the 'geom' column.
#> ℹ Some palettes were not used in the column info, adding legends for them.
#> ℹ Legend 1 did not contain color, inferring from the palette.
#> ℹ Legend 2 did not contain color, inferring from the palette.
#> ℹ Legend 3 did not contain color, inferring from the palette.
#> ℹ Legend 4 did not contain size, inferring from the labels.
#> ℹ Legend 4 did not contain color, inferring from the palette.
#> ℹ Legend 7 did not contain a geom, inferring from the column info.
#> ℹ Legend 7 did not contain labels, inferring from the geom.
#> ! Legend 7 has geom text but no specified labels, so disabling this legend for now.
#> Scale for fill is already present.
#> Adding another scale for fill, which will replace the existing scale.
#> Scale for fill is already present.
#> Adding another scale for fill, which will replace the existing scale.
#> Scale for fill is already present.
#> Adding another scale for fill, which will replace the existing scale.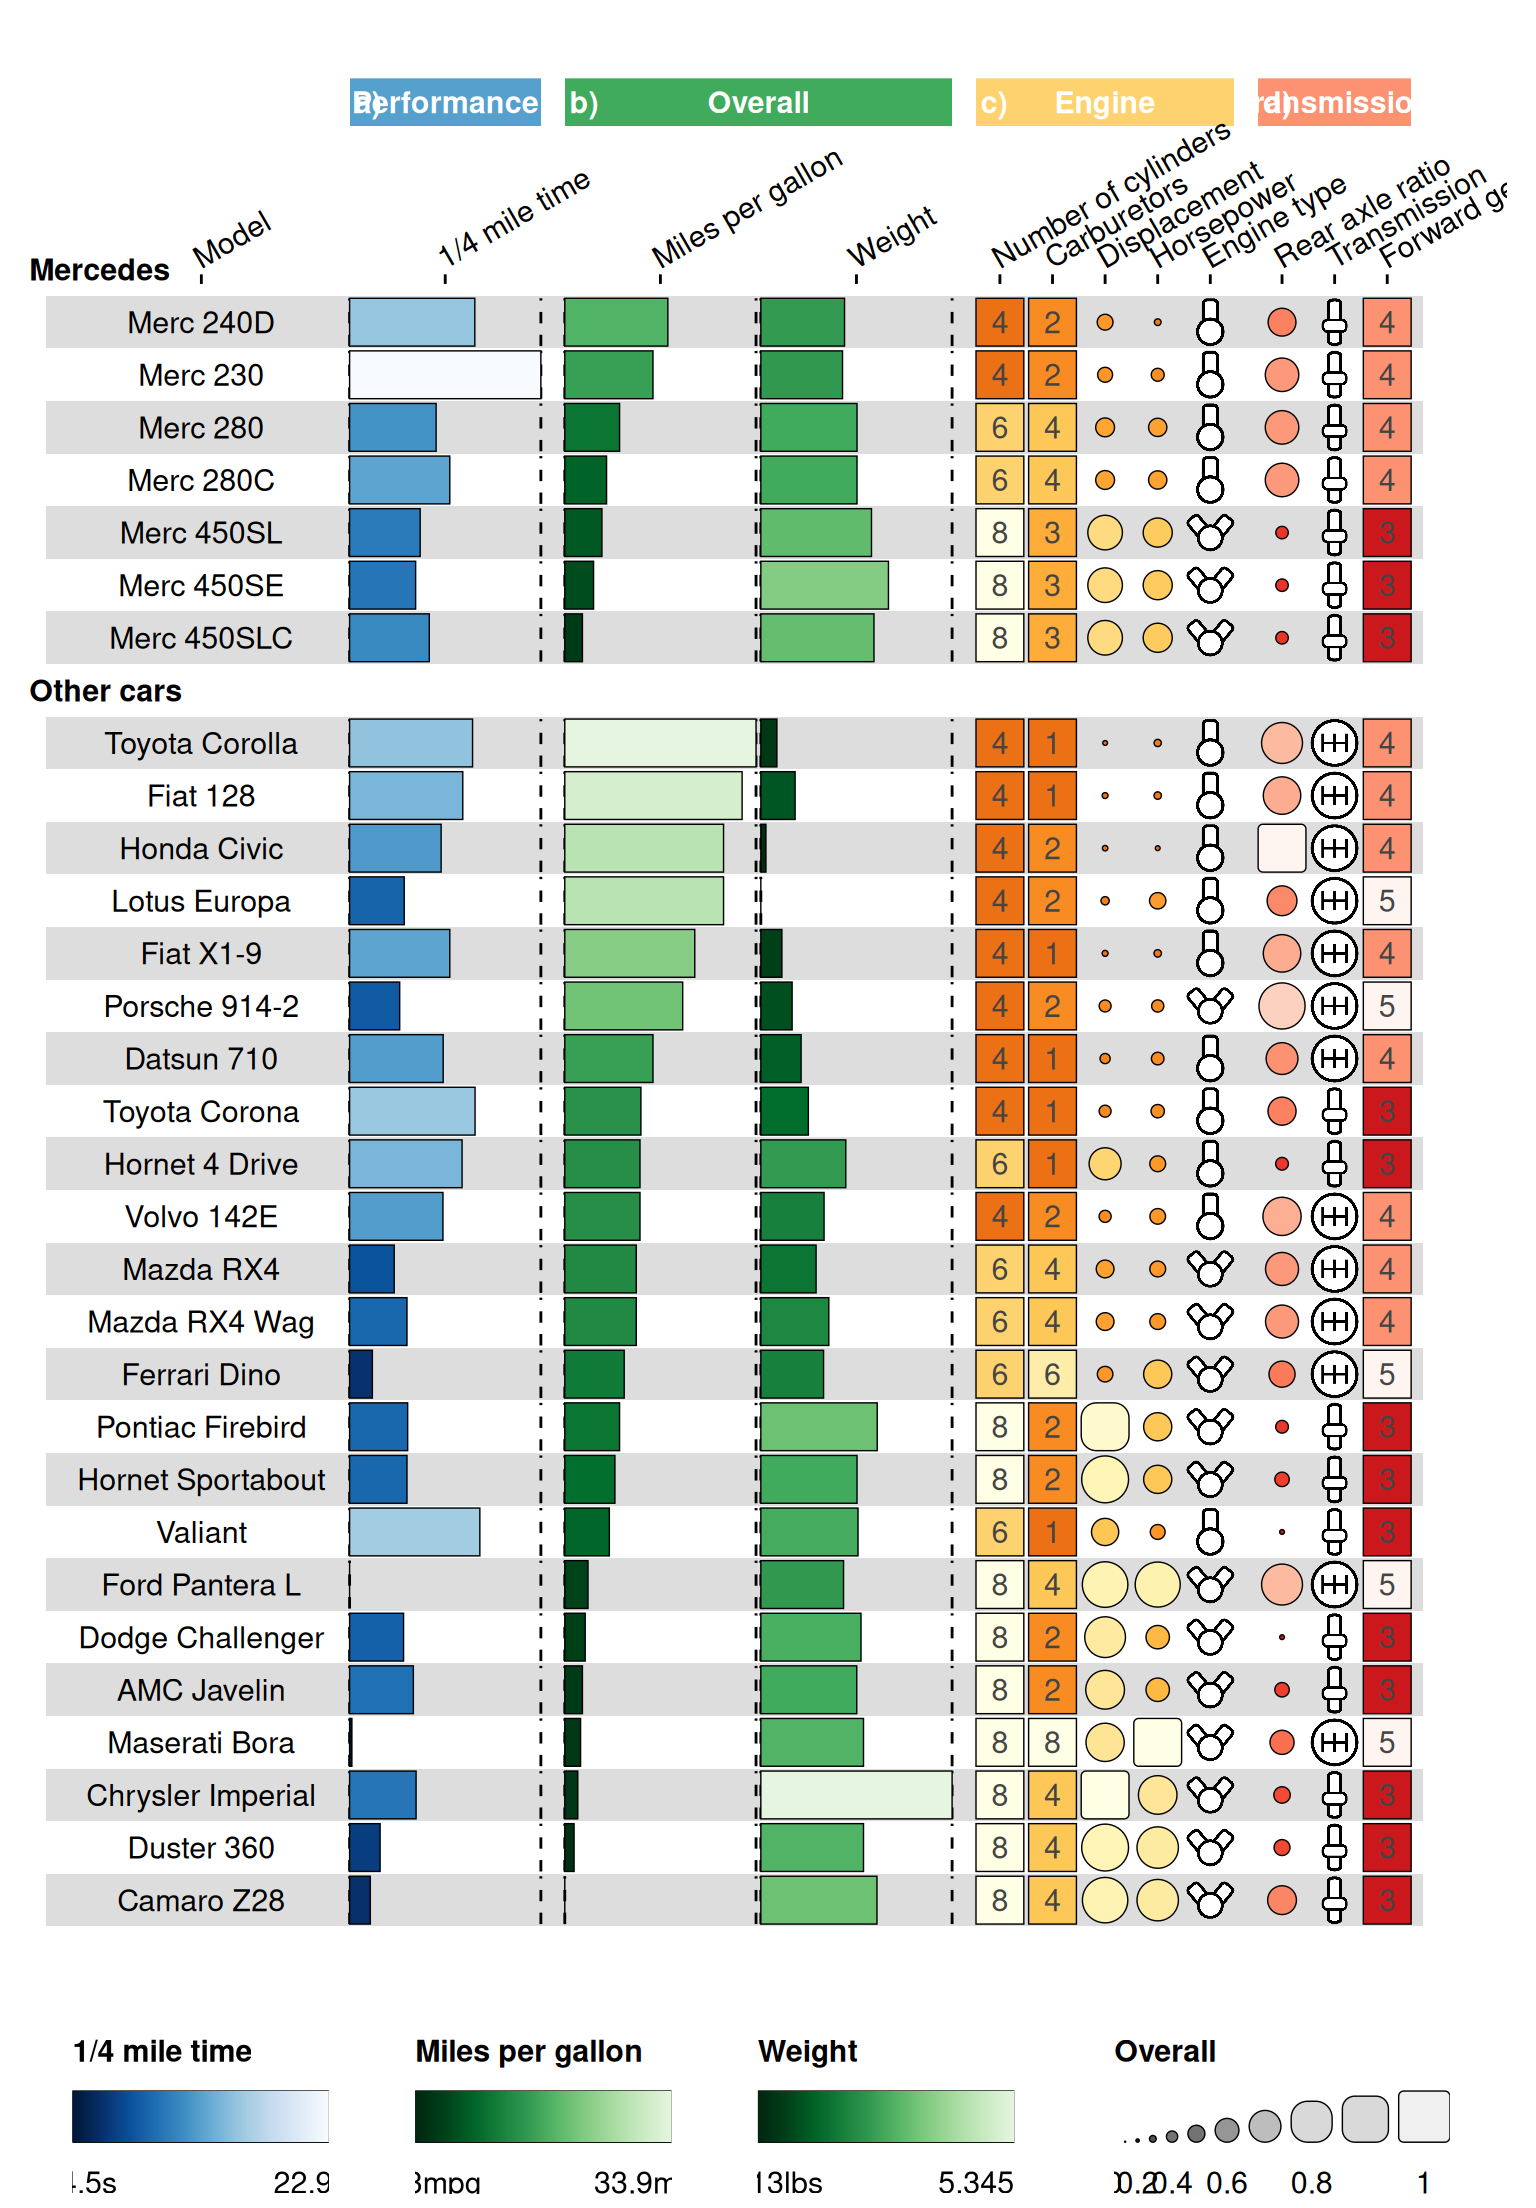
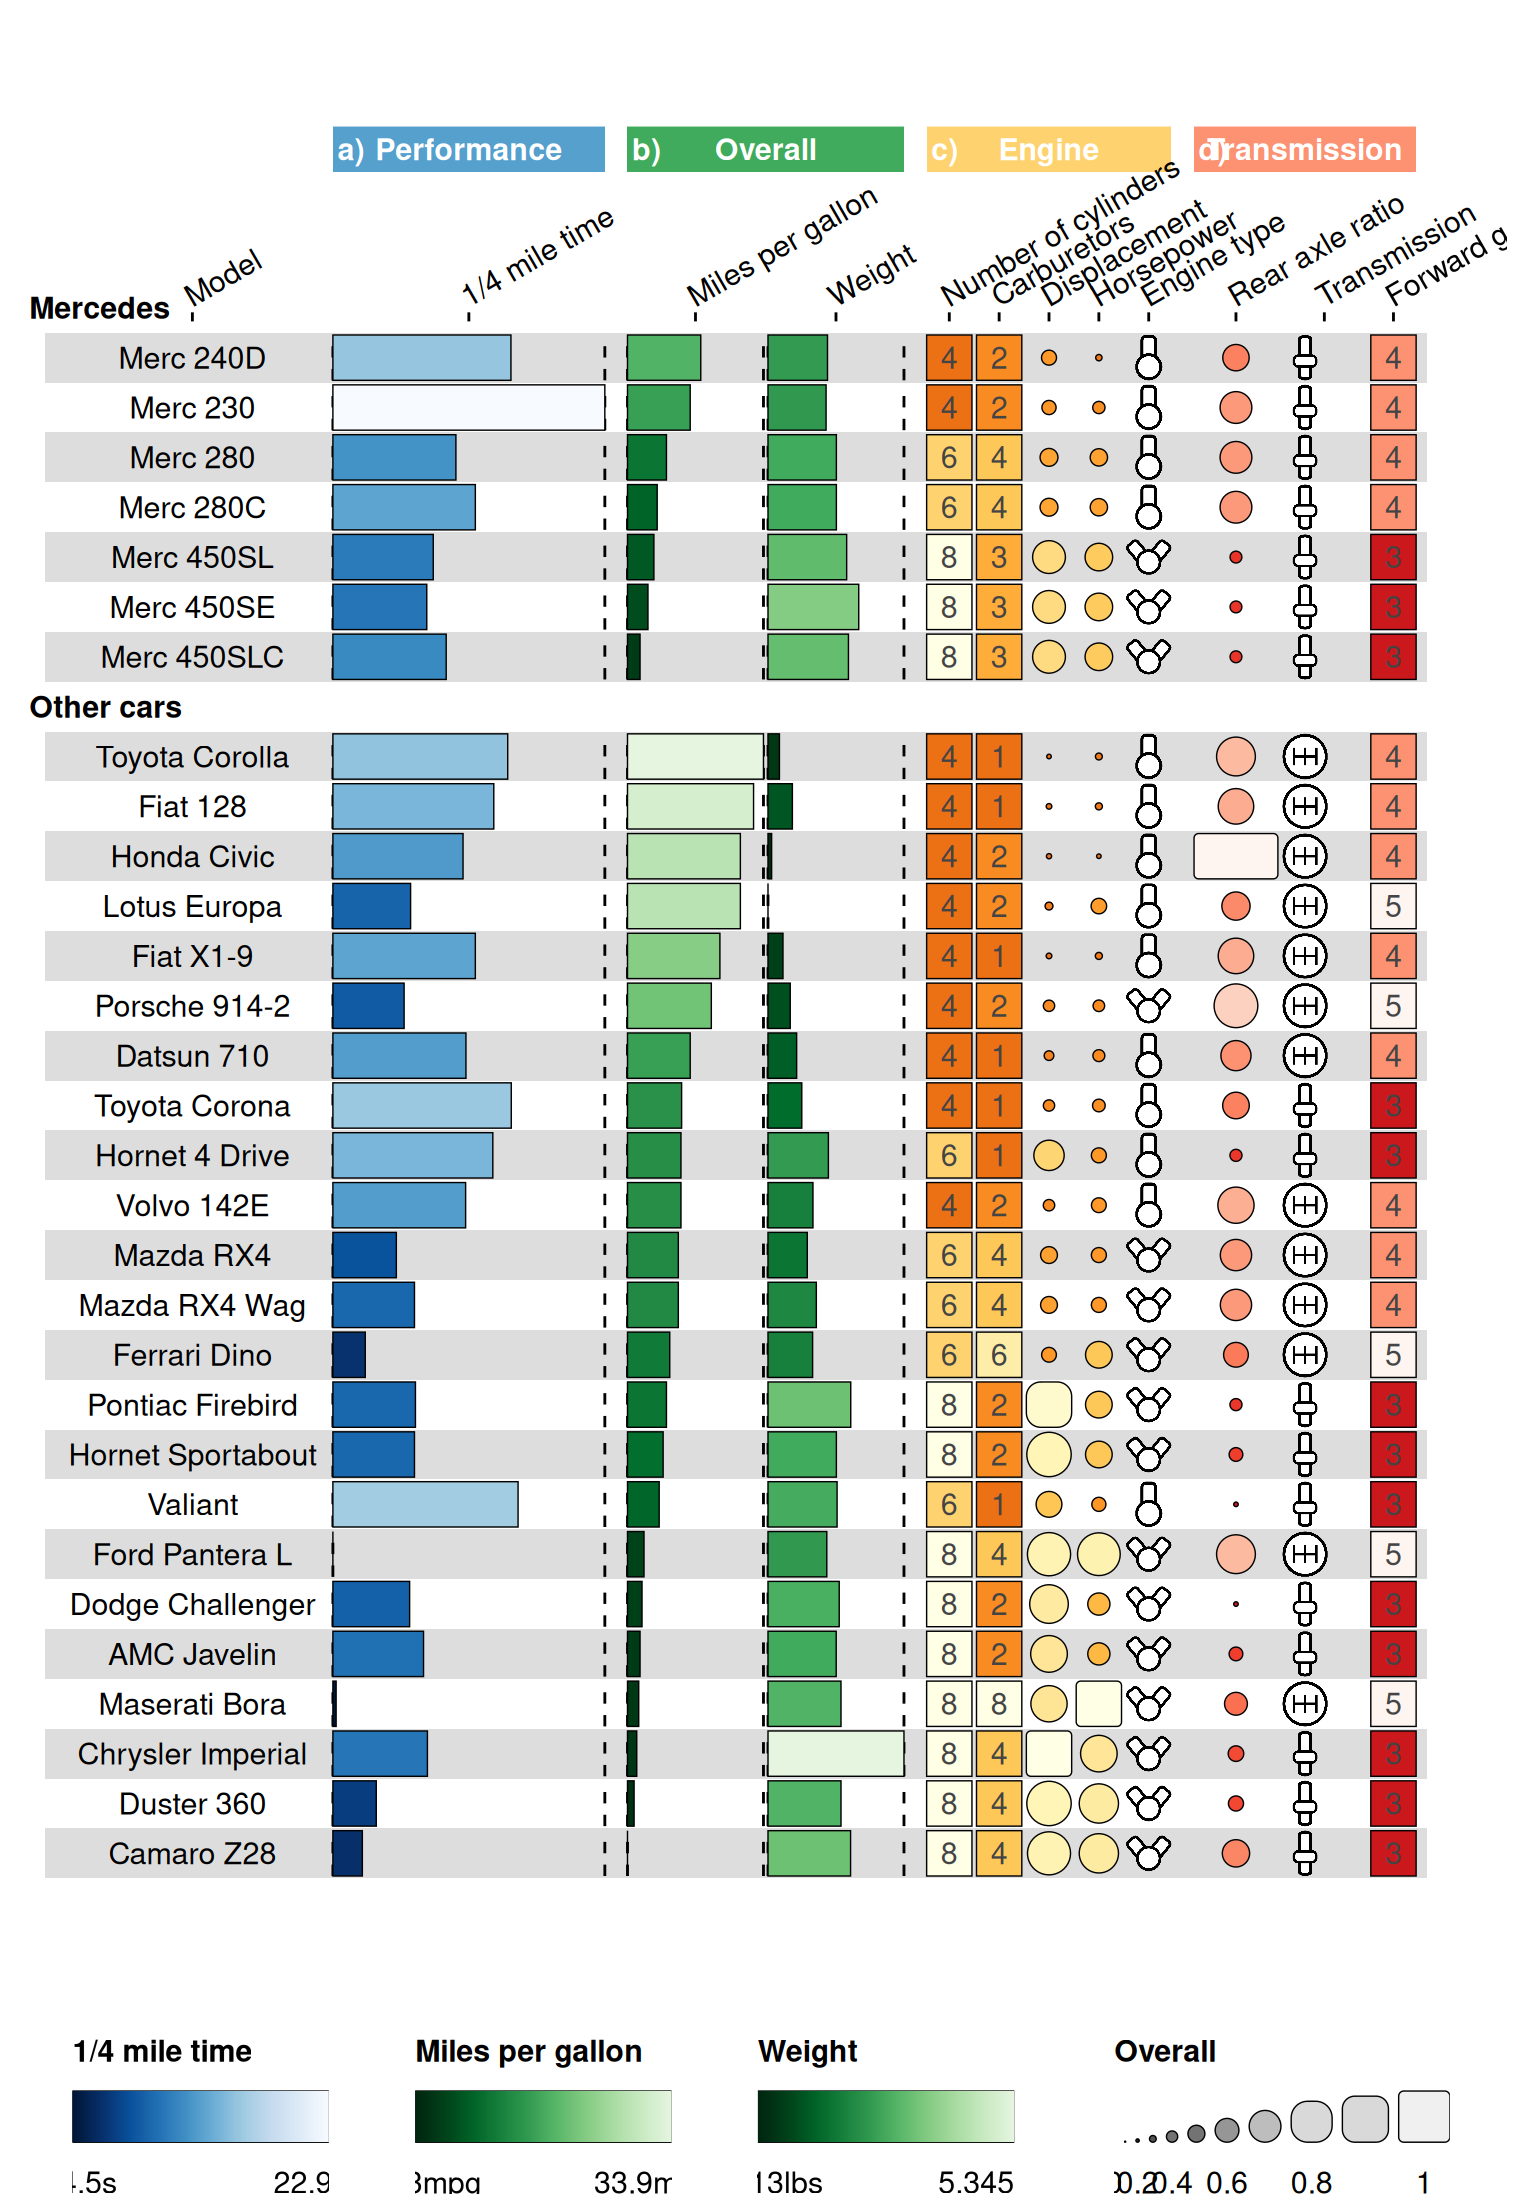
Now, we can perform some small tweaks with regard to spacing:
e.g. the Transmission column group needs slightly more
space. We can do this by specifying the width argument in
the options list in the column_info
dataframe.
If there are still some small things you want to tweak, it is
recommended to save this plot as an .svg file and use a
vector based graphics editor to make some final tweaks.
# set options of performance column
cinfo[[1, "options"]] <- list(list(width = 6))
cinfo[[2, "options"]] <- list(list(width = 6))
cinfo[[3, "options"]] <- list(list(width = 3))
cinfo[[4, "options"]] <- list(list(width = 3))
cinfo[[12, "options"]] <- list(list(width = 1.85))
cinfo[[13, "options"]] <- list(list(width = 1.85))

funky_heatmap(data, column_info = cinfo, column_groups = column_groups, palettes = palettes, legends = legends, row_info = row_info, row_groups = row_groups)
#> ℹ Column info did not contain a column called 'legend', generating options based on the 'geom' column.
#> ℹ Some palettes were not used in the column info, adding legends for them.
#> ℹ Legend 1 did not contain color, inferring from the palette.
#> ℹ Legend 2 did not contain color, inferring from the palette.
#> ℹ Legend 3 did not contain color, inferring from the palette.
#> ℹ Legend 4 did not contain size, inferring from the labels.
#> ℹ Legend 4 did not contain color, inferring from the palette.
#> ℹ Legend 7 did not contain a geom, inferring from the column info.
#> ℹ Legend 7 did not contain labels, inferring from the geom.
#> ! Legend 7 has geom text but no specified labels, so disabling this legend for now.
#> Scale for fill is already present.
#> Adding another scale for fill, which will replace the existing scale.
#> Scale for fill is already present.
#> Adding another scale for fill, which will replace the existing scale.
#> Scale for fill is already present.
#> Adding another scale for fill, which will replace the existing scale.