Example usage: mtcars dataset
We use the mtcars dataset to demonstrate the usage of the funkyheatmappy package.
import funkyheatmappy
import pandas as pd

mtcars = pd.read_csv("./test/data/mtcars.csv")
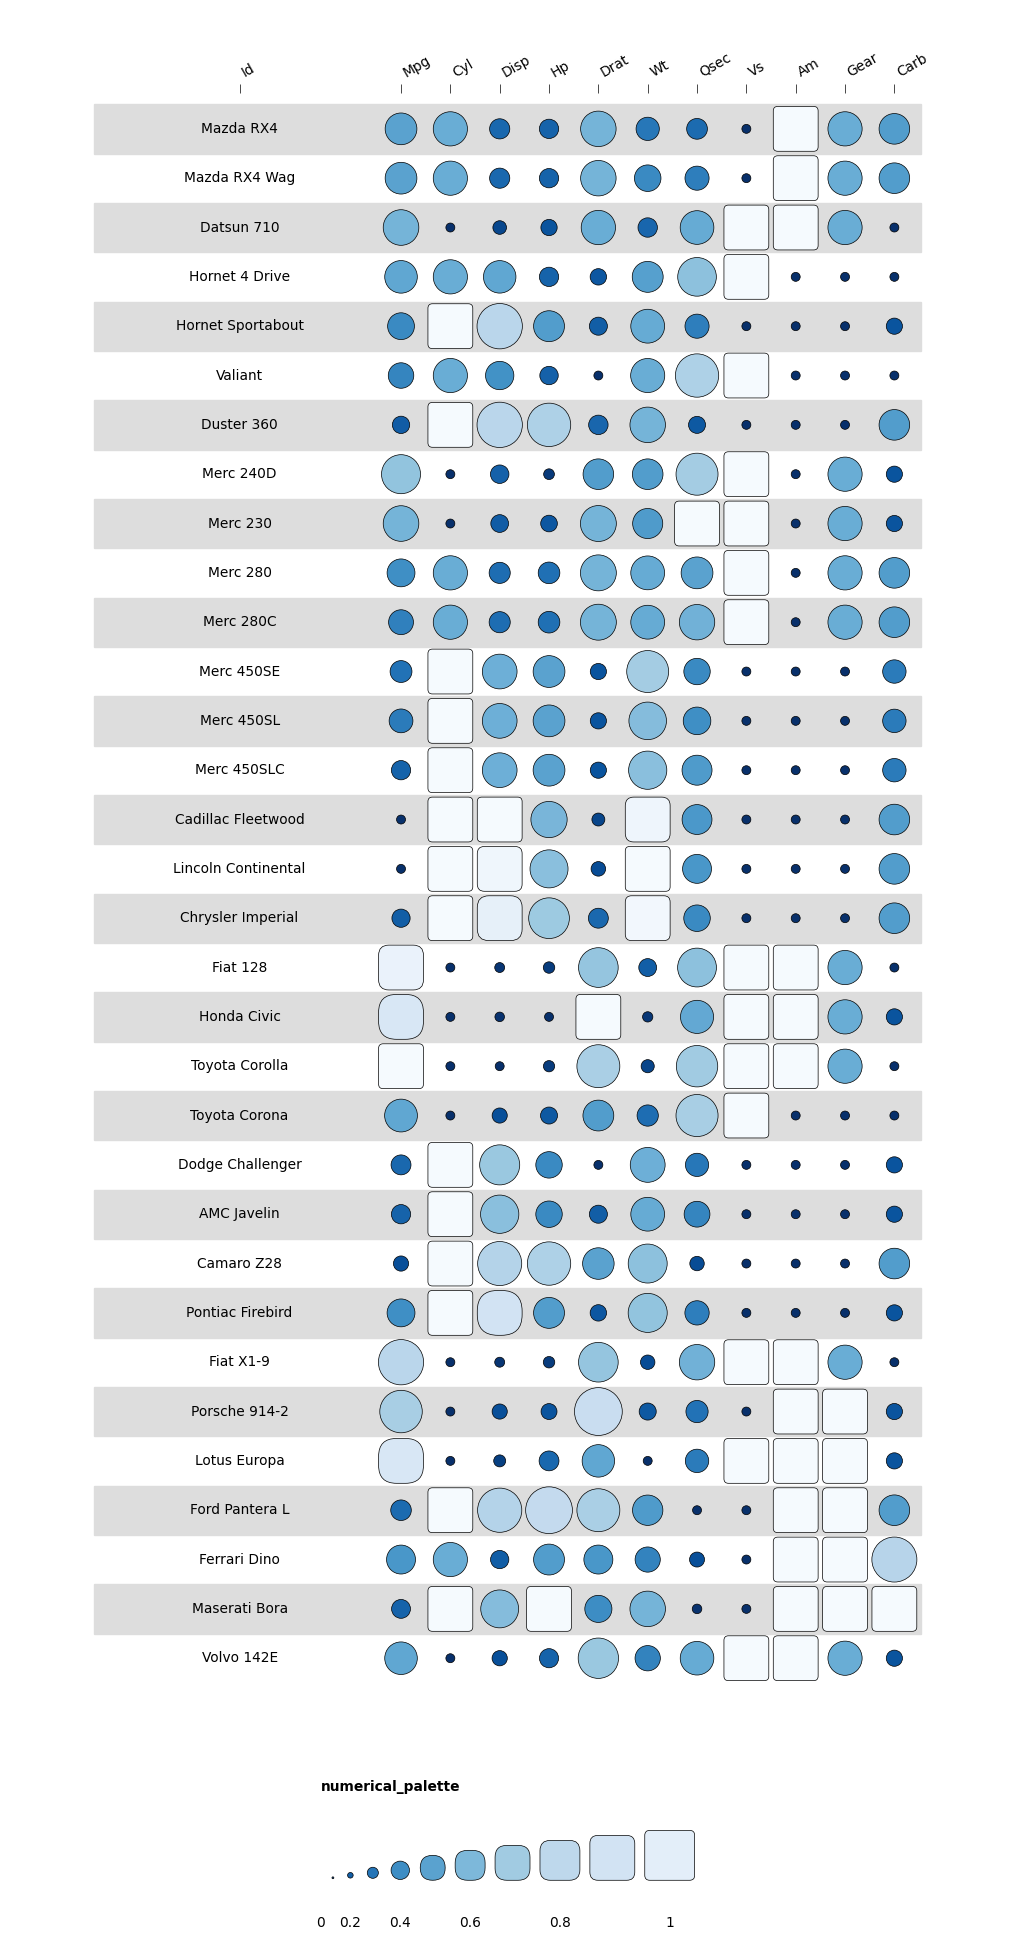
The most basic usage of the package is to call the funkyheatmap function with the mtcars dataset as input. This will generate a basic funkyheatmap, only using the funkyheatmap geom.
funkyheatmappy.funkyheatmap(mtcars)

However, it’s easy to add some more information and style the plot better.
Column info and column column_groups
Metadata about the columns can be provided in the column_info DataFrame.
The column_info DataFrame has the following columns:
id: the column name
group: the group to which the column belongs (which we will specify in the column_groups DataFrame)
name: the name of the column, which will be displayed in the plot
geom: the geometry of the column, such as “bar”, “circle”, “text”, “funkyrect”, etc.
options: a dictionary with options for the geometry, such as alignment or width
palette: the palette to use for the column (which we will specify in the column_groups DataFrame)
mtcars = mtcars.rename(columns={"Unnamed: 0": "id"})

column_lists = [
    ["id", "group", "name", "geom", "options", "palette"],
    ["id", np.nan, "", "text", {"ha": 0, "width": 6}, np.nan],
    ["mpg", "overall", "Miles / gallon", "bar", {"width": 4, "legend": False}, "palette1"],
    ["cyl", "overall", "Number of cylinders", "bar", {"width": 4, "legend": False}, "palette2"],
    ["disp", "group1", "Displacement (cu.in.)", "funkyrect", dict(), "palette1"],
    ["hp", "group1", "Gross horsepower", "funkyrect", dict(), "palette1"],
    ["drat", "group1", "Rear axle ratio", "funkyrect", dict(), "palette1"],
    ["wt", "group1", "Weight (1000 lbs)", "funkyrect", dict(), "palette1"],
    ["qsec", "group2", "1/4 mile time", "circle", dict(), "palette2"],
    ["vs", "group2", "Engine", "circle", dict(), "palette2"],
    ["am", "group2", "Transmission", "circle", dict(), "palette2"],
    ["gear", "group2", "# Forward gears", "circle", dict(), "palette2"],
    ["carb", "group2", "# Carburetors", "circle", dict(), "palette2"],
]

column_info = pd.DataFrame(column_lists[1:], columns=column_lists[0])
column_info.index = column_info["id"]
The column_groups DataFrame contains the following columns:
Category: the name of the category to which the measurements annotated with this group belong, which will be displayed in the plot
group: the group to which the measurements annotated with this group belong
palette: the palette to use for the measurements annotated with this group
column_groups = pd.DataFrame(columns=["Category", "group", "palette"],
                            data = [["Overall", "overall", "overall"],
                                    ["Group1", "group1", "palette1"],
                                    ["Group2", "group2", "palette2"]]
                            )
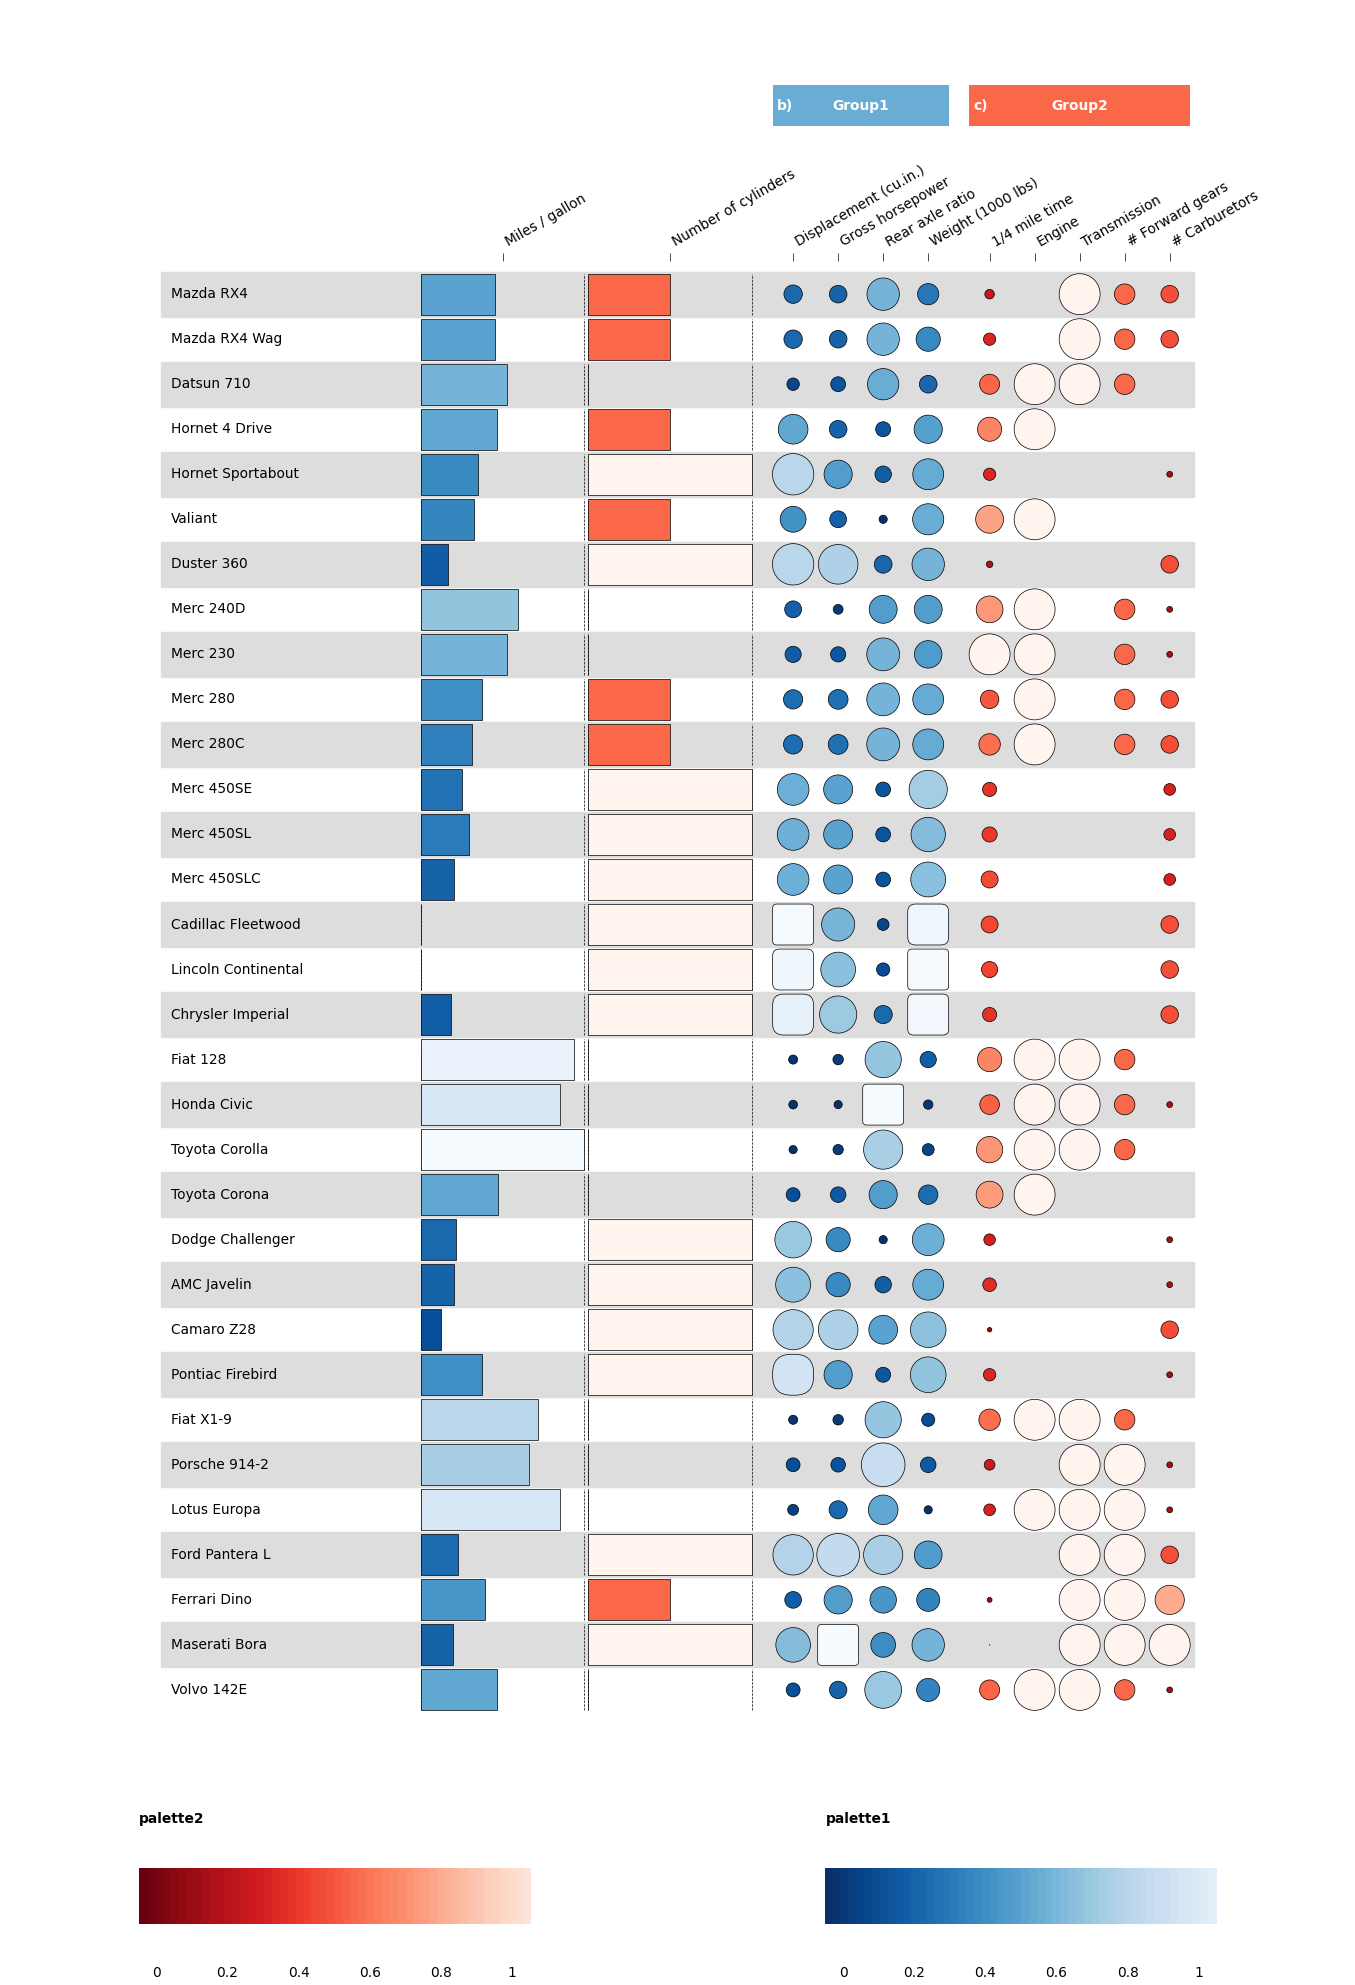
Finally, we can call the funkyheatmap function with the mtcars dataset, the column_info DataFrame, and the column_groups DataFrame as input.
funkyheatmappy.funkyheatmap(mtcars, column_info = column_info, column_groups = column_groups)
