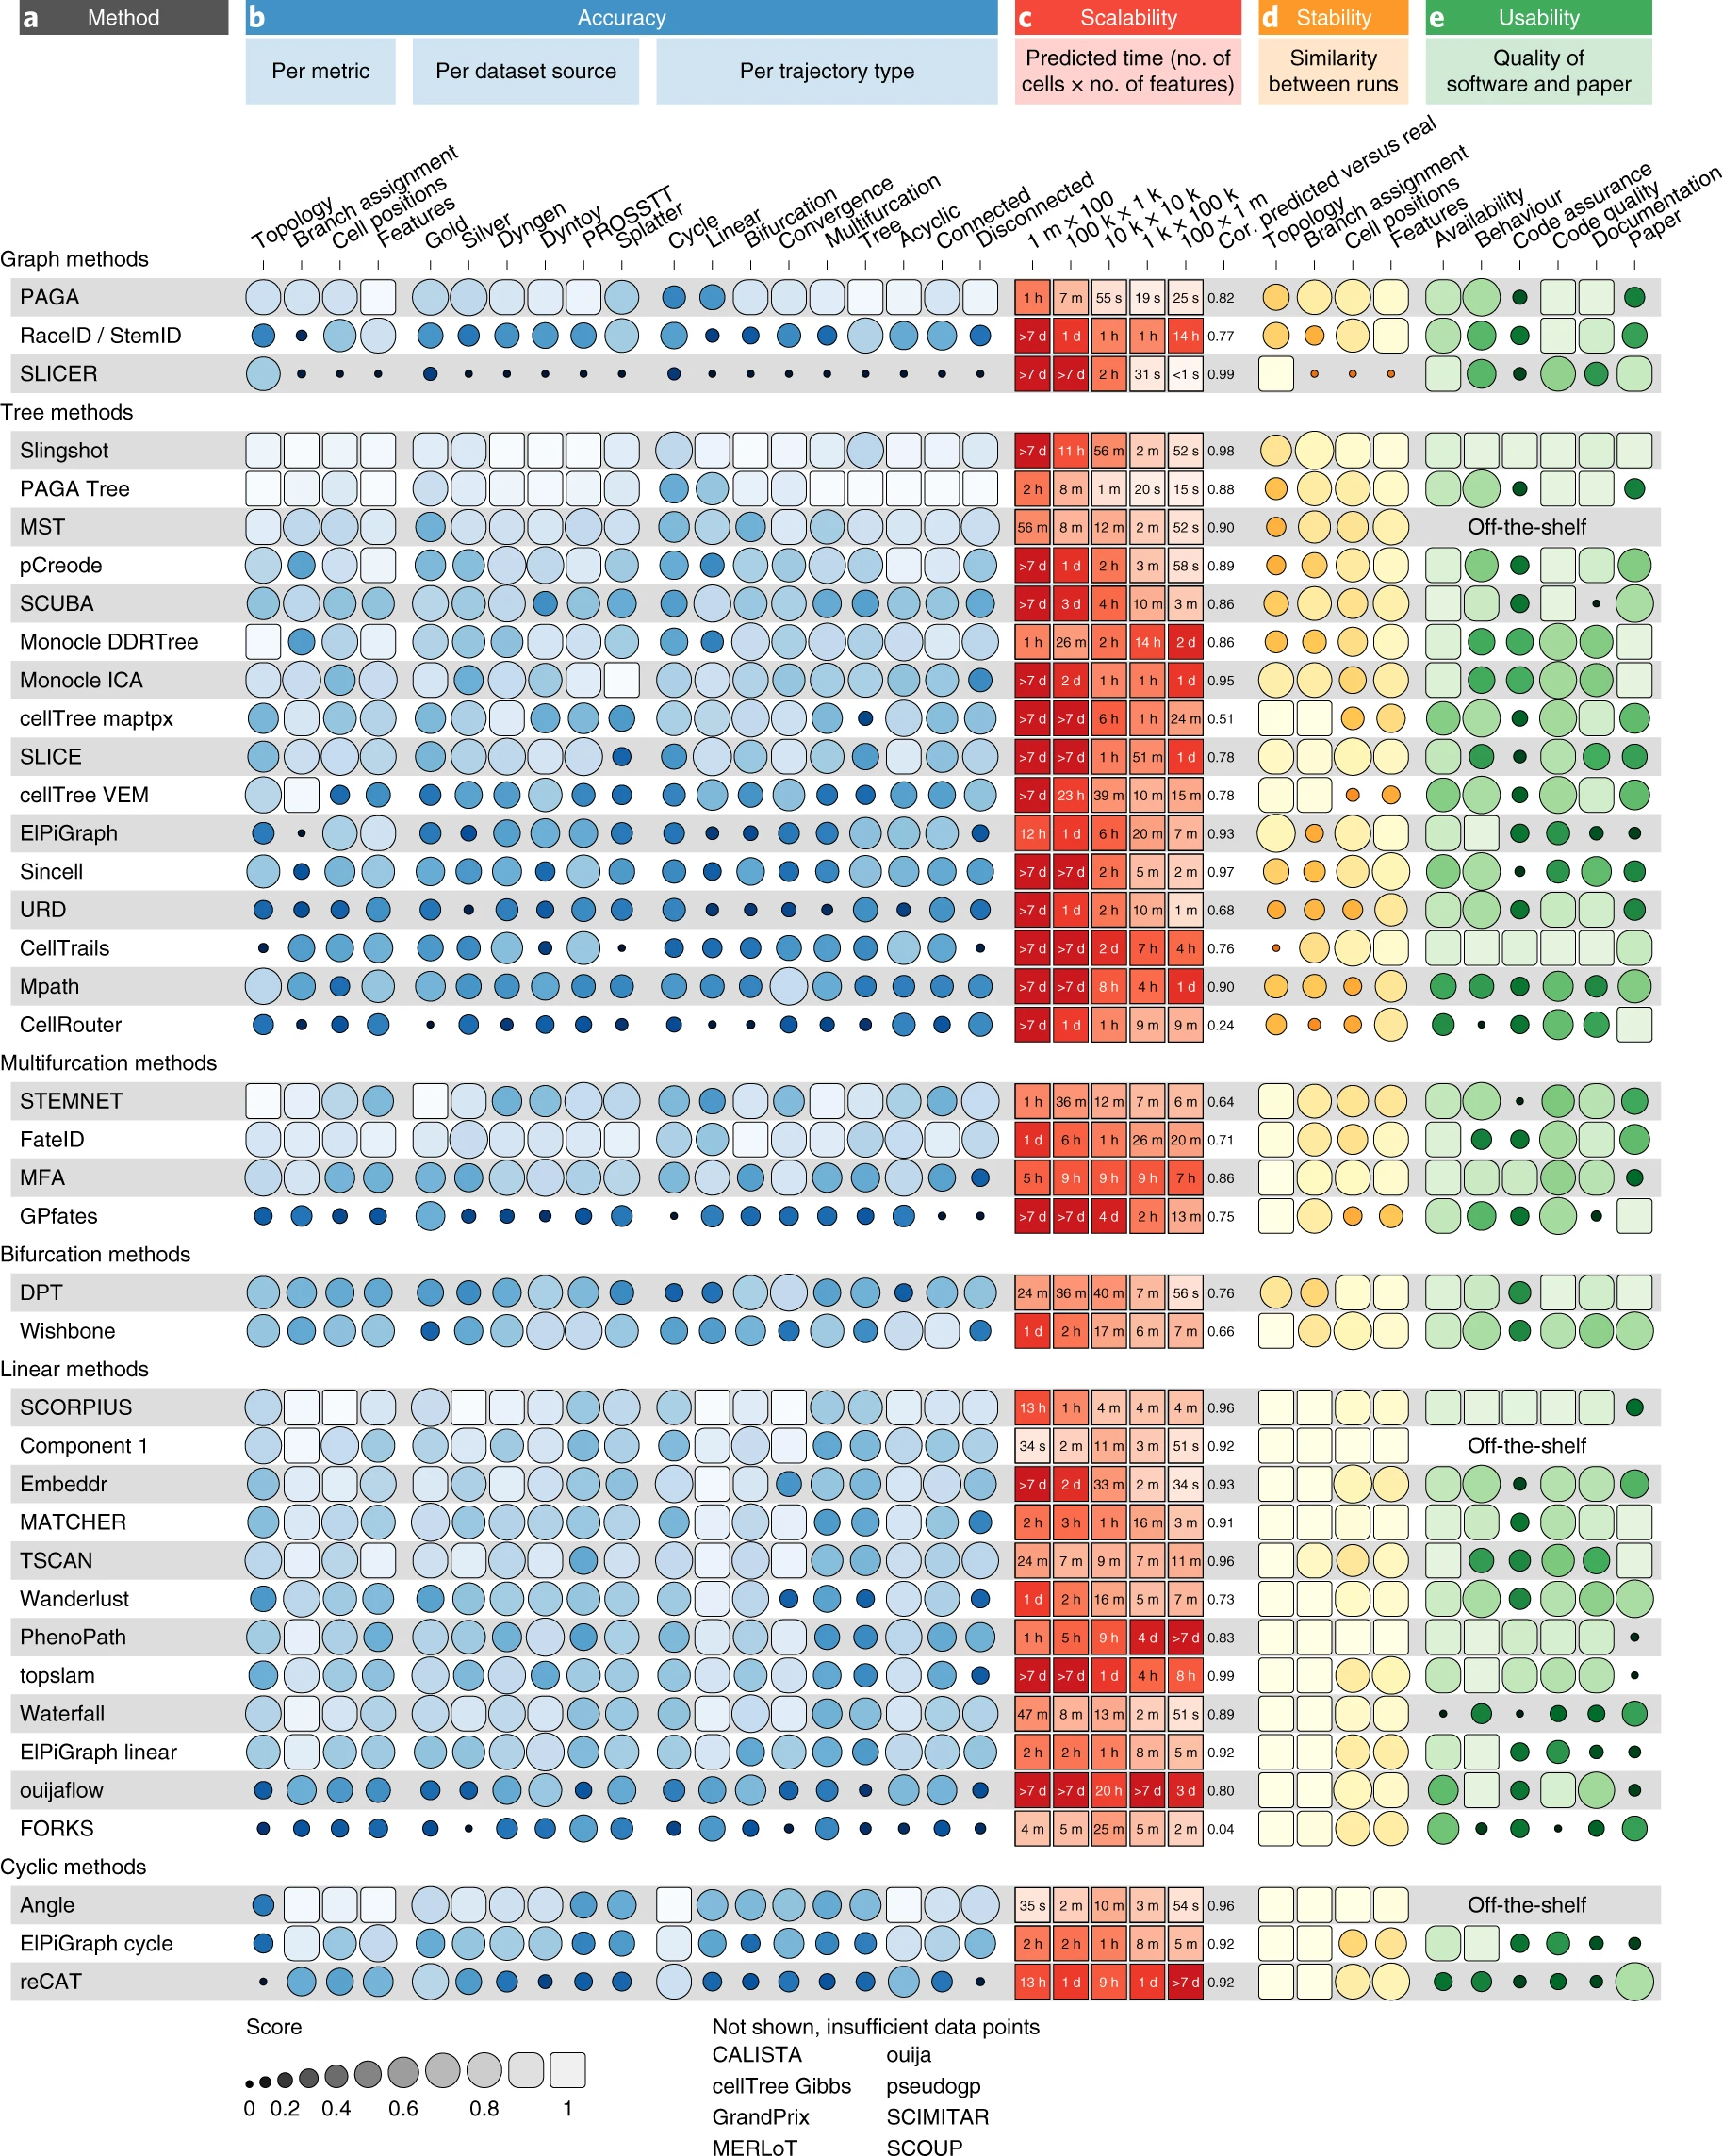
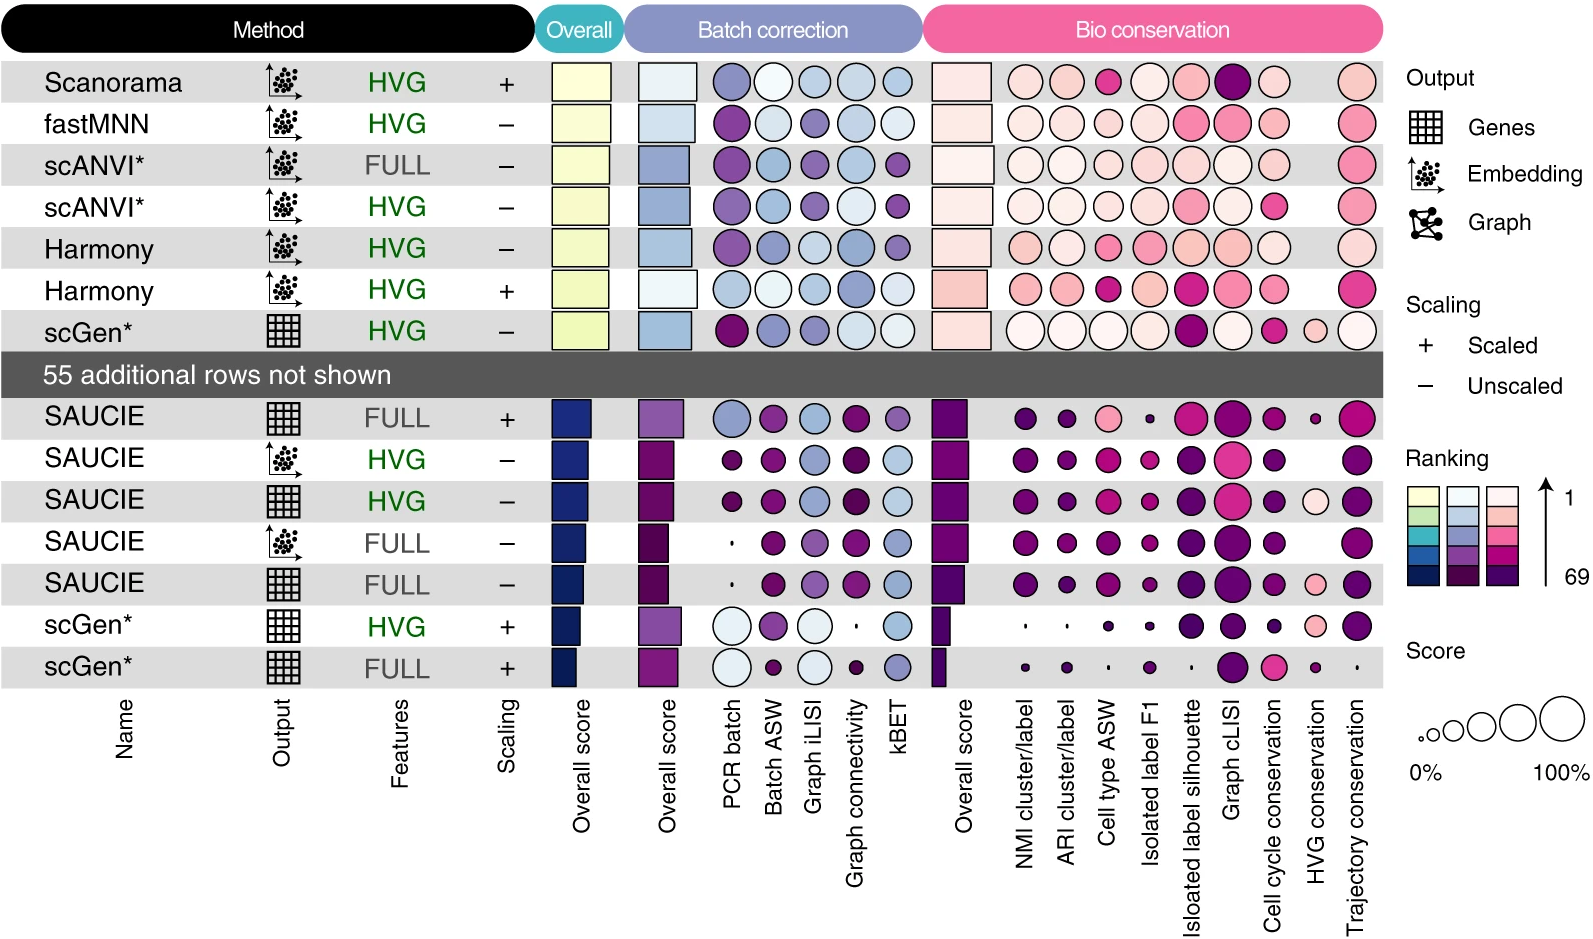
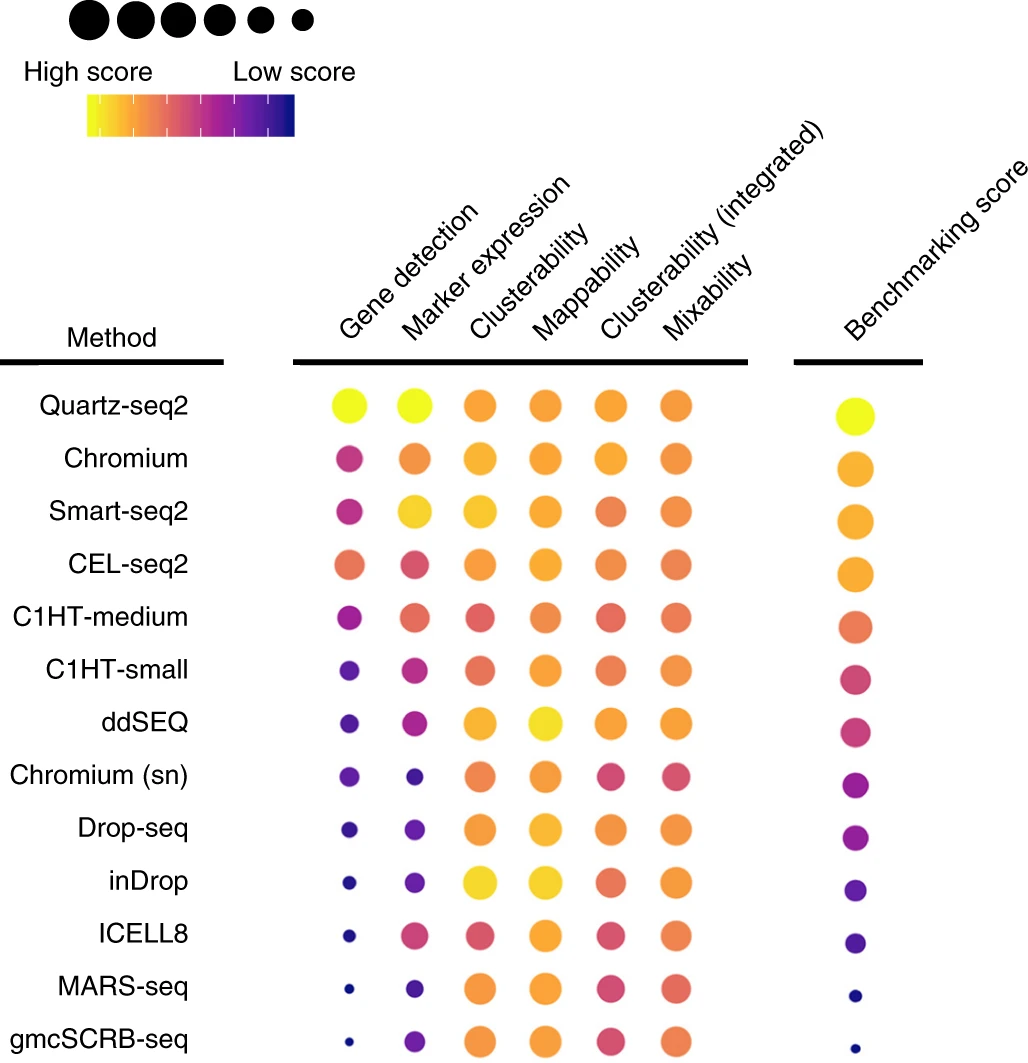
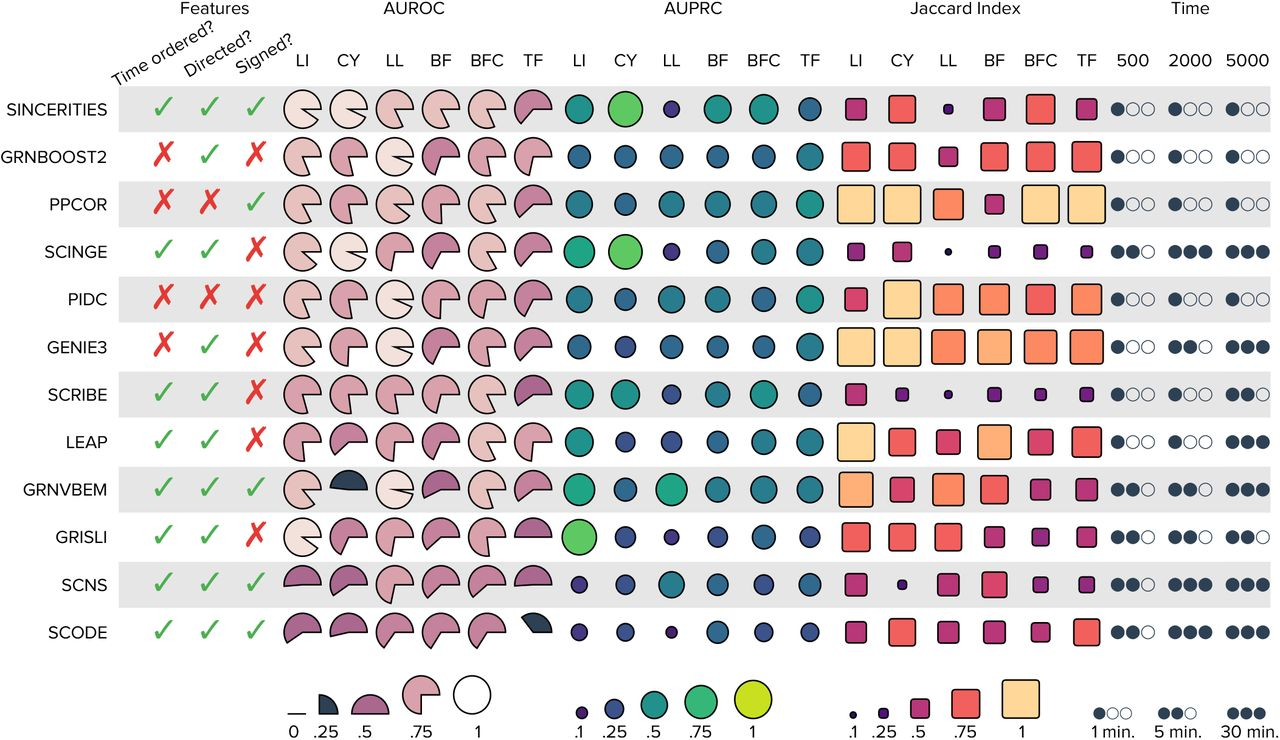
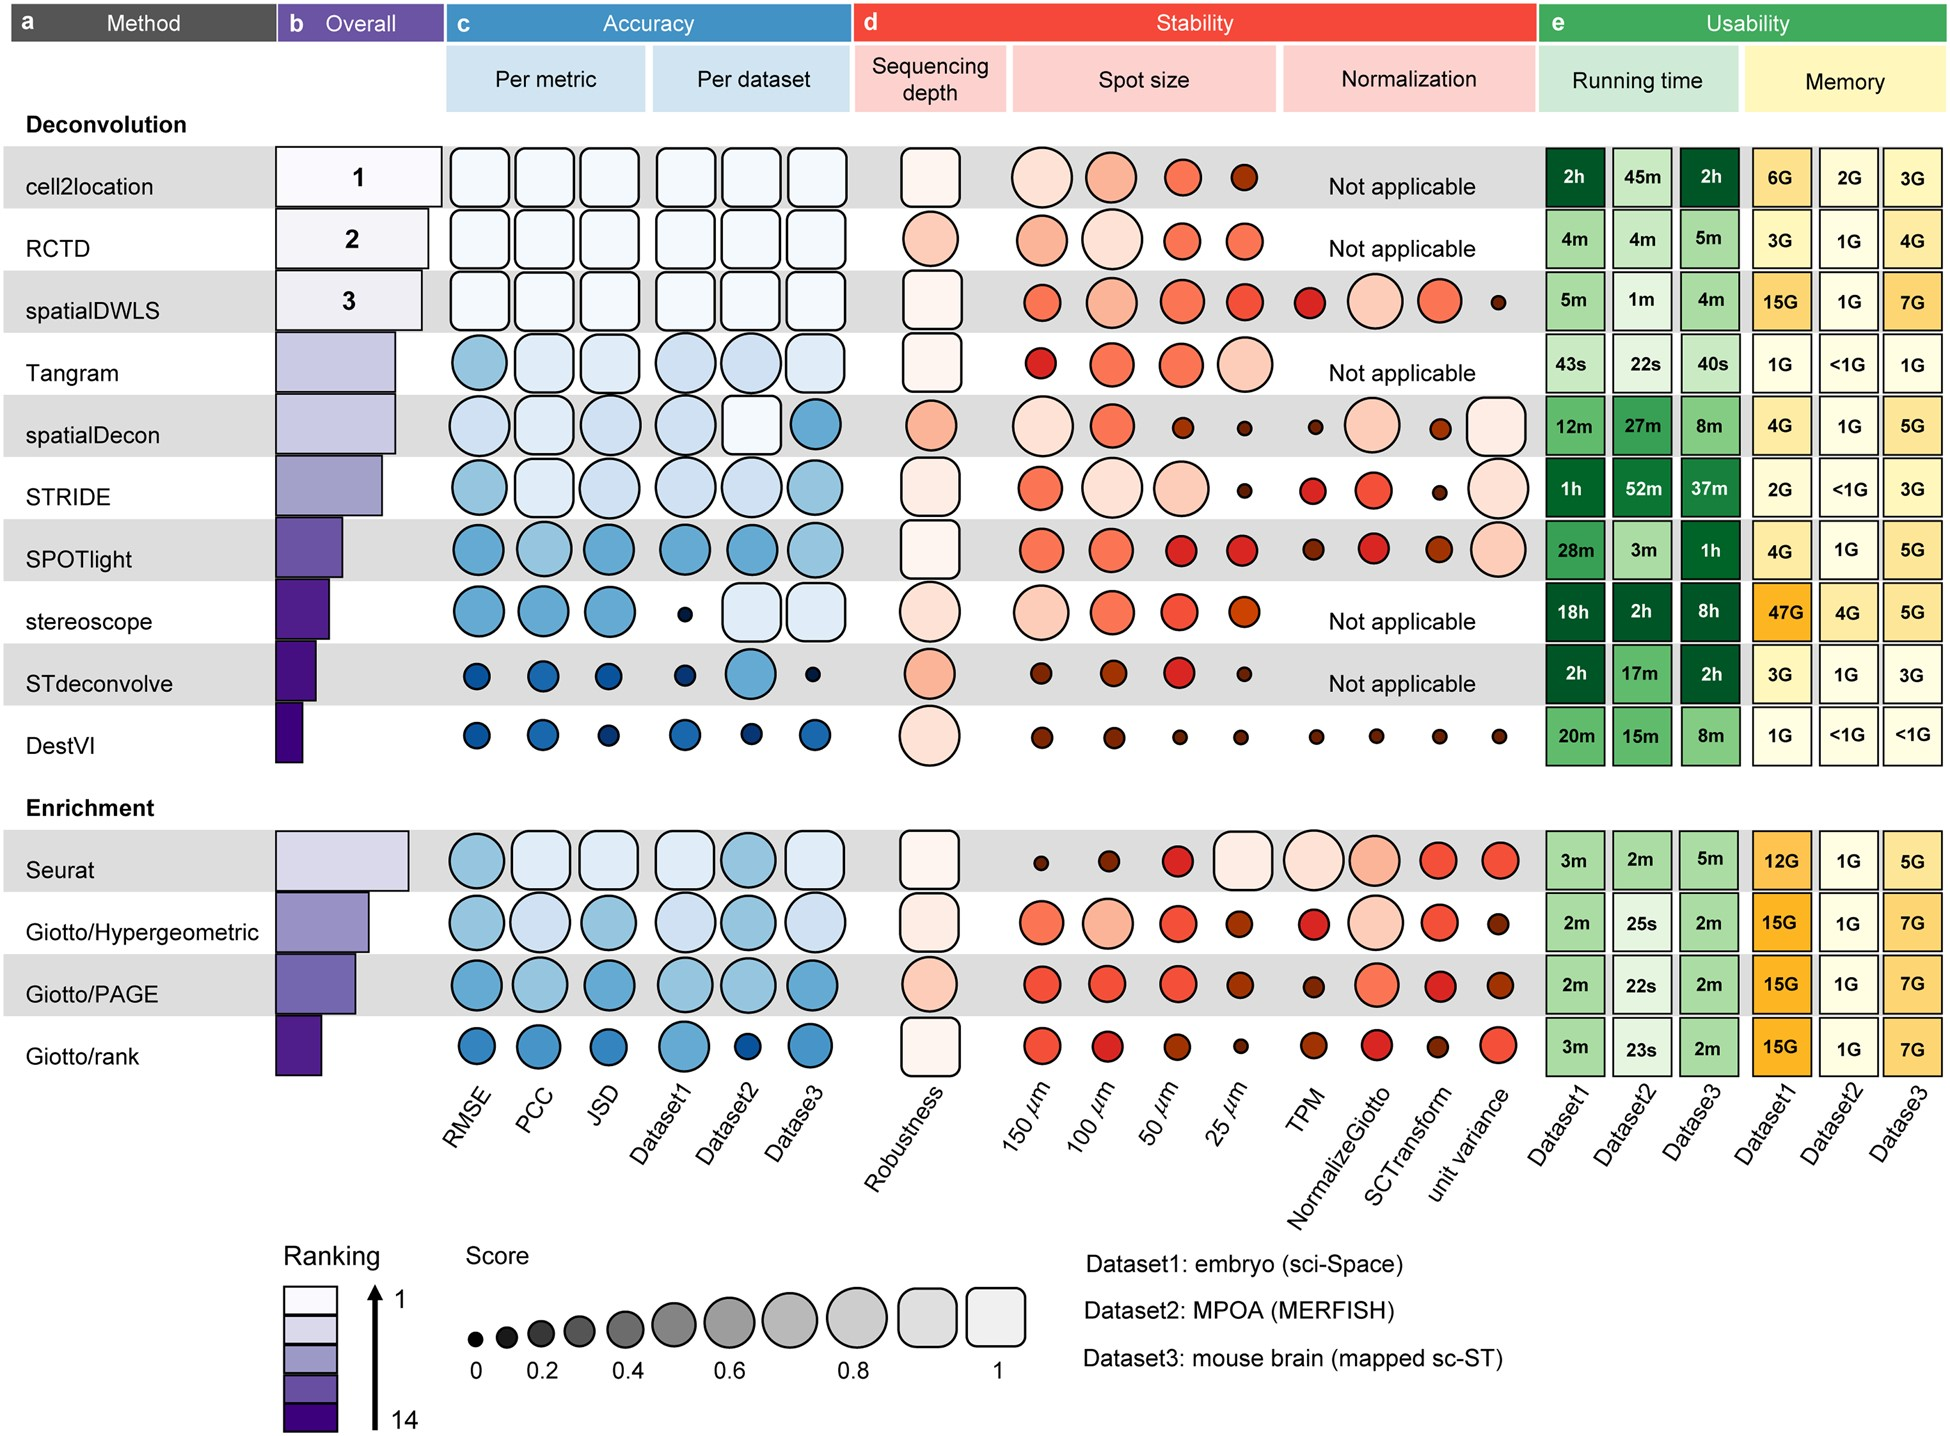
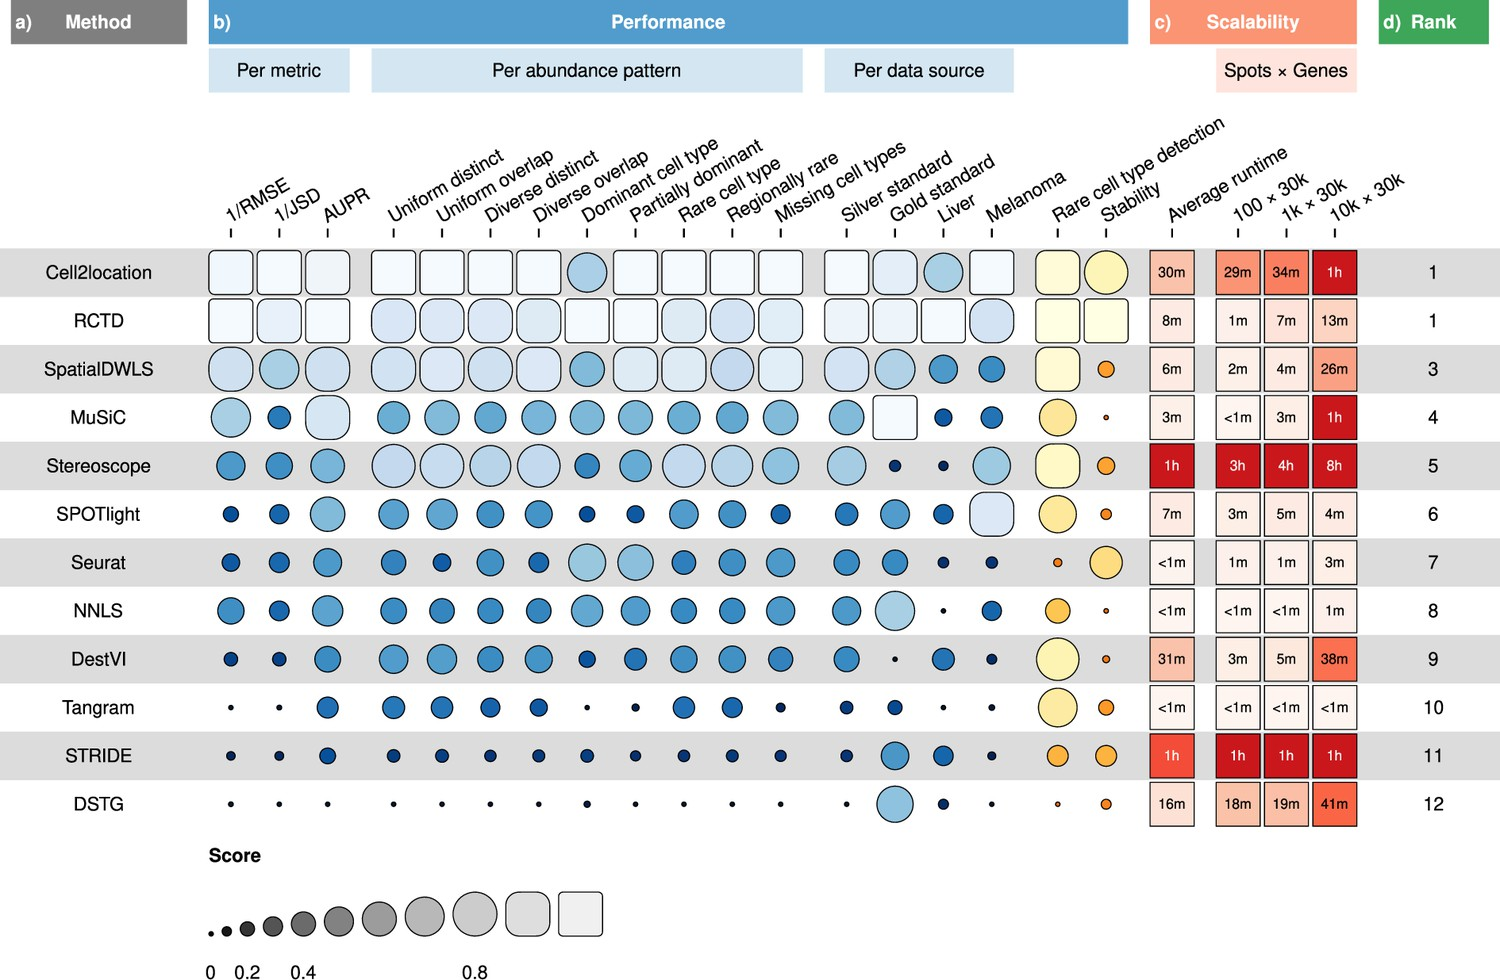
{funkyheatmap}: Visualising data frames with mixed data types

{funkyheatmap} is a way for creating customisable heatmaps.

Installation

You can install funkyheatmap like so:

install.packages("funkyheatmap")

Example

Let’s use the mtcars dataset as an example of what a funky heatmap looks like.

library(funkyheatmap)
library(dplyr)
library(tibble)

data <- mtcars %>%
  rownames_to_column("id") %>%
  arrange(desc(mpg))

column_info <- tribble(
  ~id,     ~group,         ~name,                      ~geom,        ~palette,    ~options,
  "id",    "",             "",                         "text",       NA,          list(hjust = 0, width = 6),
  "mpg",   "overall",      "Miles / gallon",           "bar",        "palette1",  list(width = 4, legend = FALSE),
  "cyl",   "overall",      "Number of cylinders",      "bar",        "palette2",  list(width = 4, legend = FALSE),
  "disp",  "group1",       "Displacement (cu.in.)",    "funkyrect",  "palette1",  lst(),
  "hp",    "group1",       "Gross horsepower",         "funkyrect",  "palette1",  lst(),
  "drat",  "group1",       "Rear axle ratio",          "funkyrect",  "palette1",  lst(),
  "wt",    "group1",       "Weight (1000 lbs)",        "funkyrect",  "palette1",  lst(),
  "qsec",  "group2",       "1/4 mile time",            "circle",     "palette2",  lst(),
  "vs",    "group2",       "Engine",                   "circle",     "palette2",  lst(),
  "am",    "group2",       "Transmission",             "circle",     "palette2",  lst(),
  "gear",  "group2",       "# Forward gears",          "circle",     "palette2",  lst(),
  "carb",  "group2",       "# Carburetors",            "circle",     "palette2",  lst()
)

funky_heatmap(data, column_info = column_info, expand = list(xmax = 4))

More information

Works with funkyheatmap(-like) visualisations

  • Saelens et al. (2019)
  • Luecken et al. (2021)
  • Mereu et al. (2020)
  • Pratapa et al. (2019)
  • Yan and Sun (2022)
  • Sang-aram et al. (2023)

Create a PR to include your work in this list!

References

Luecken, Malte D., M. Büttner, K. Chaichoompu, A. Danese, M. Interlandi, M. F. Mueller, D. C. Strobl, et al. 2021. “Benchmarking Atlas-Level Data Integration in Single-Cell Genomics.” Nature Methods 19 (1): 41–50. https://doi.org/10.1038/s41592-021-01336-8.
Mereu, Elisabetta, Atefeh Lafzi, Catia Moutinho, Christoph Ziegenhain, Davis J. McCarthy, Adrián Álvarez-Varela, Eduard Batlle, et al. 2020. “Benchmarking Single-Cell RNA-Sequencing Protocols for Cell Atlas Projects.” Nature Biotechnology 38 (6): 747–55. https://doi.org/10.1038/s41587-020-0469-4.
Pratapa, Aditya, Amogh P. Jalihal, Jeffrey N. Law, Aditya Bharadwaj, and T. M. Murali. 2019. “Benchmarking Algorithms for Gene Regulatory Network Inference from Single-Cell Transcriptomic Data,” May. https://doi.org/10.1101/642926.
Saelens, Wouter, Robrecht Cannoodt, Helena Todorov, and Yvan Saeys. 2019. “A Comparison of Single-Cell Trajectory Inference Methods.” Nature Biotechnology 37 (5): 547–54. https://doi.org/10.1038/s41587-019-0071-9.
Sang-aram, Chananchida, Robin Browaeys, Ruth Seurinck, and Yvan Saeys. 2023. “Spotless: A Reproducible Pipeline for Benchmarking Cell Type Deconvolution in Spatial Transcriptomics,” March. https://doi.org/10.1101/2023.03.22.533802.
Yan, Lulu, and Xiaoqiang Sun. 2022. “Benchmarking and Integration of Methods for Deconvoluting Spatial Transcriptomic Data.” Edited by Janet Kelso. Bioinformatics 39 (1). https://doi.org/10.1093/bioinformatics/btac805.